The Roundhill China Dragons ETF (DRAG) provides investors equal weight exposure to a concentrated basket of nine of the largest and most innovative Chinese companies: Tencent, PDD Holdings, Alibaba, Meituan, BYD, Xiaomi, JD.com, Baidu, and NetEase. Despite rising fears around tariffs and a potential U.S.-China trade war, DRAG is trading at all-time highs. DRAG is up 23.7% on a total return basis year-to-date, beating the S&P 500 by roughly 22% in 2025.
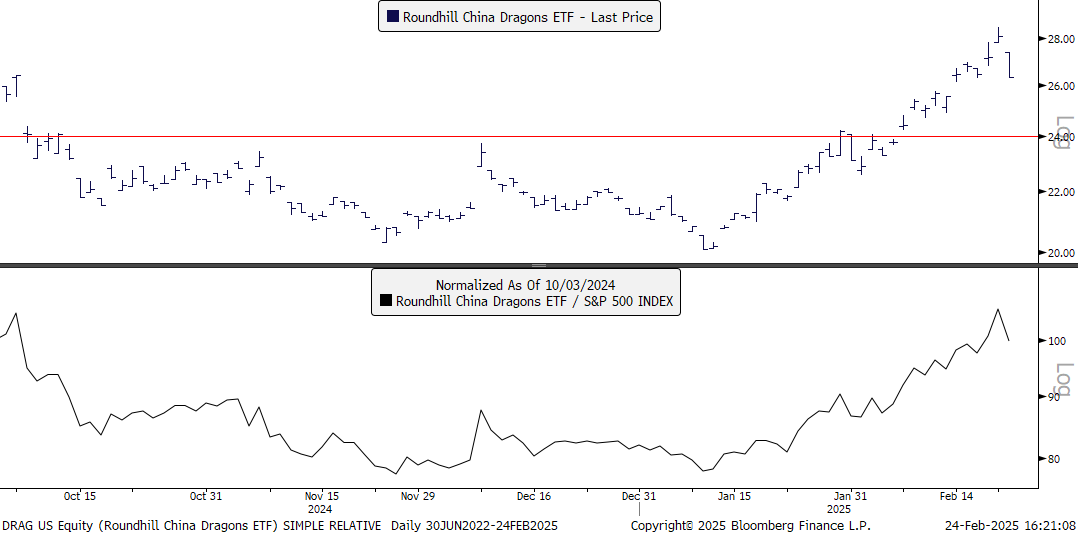
Source: Bloomberg; Data as of February 24, 2025. "Normalized" refers to adjusting data to a common scale or baseline, which allows for easier comparison between different datasets, even if they have different units, magnitudes, or starting points. The performance data quoted represents past performance. Past performance does not guarantee future results. Current performance may be lower or higher than the performance data quoted. The investment return and principal value of an investment will fluctuate so that an investor's shares, when sold or redeemed, may be worth more or less than their original cost. Returns less than one year are not annualized. For the most recent month-end performance, please call (855) 561-5728. For more information, including current holdings and standardized performance: https://www.roundhillinvestments.com/etf/drag/
Let’s break down the price action for each of the China Dragons – nine leaders in Chinese tech and innovation.
Alibaba - BABA
BABA has exhibited incredible momentum to start 2025. Since January 13, the stock is up over ~70%. In the short-term, it’s fair to argue that BABA is due for a breather and is overbought. Interestingly, the longer term chart paints a different picture: a stock that has been trading in a multi-year range on the cusp of breaking out. BABA has seen its relative performance perk up versus the S&P 500 and is on the cusp of fresh relative highs. Given the bullish response of BABA post earnings results, we believe the move could be in the early innings.
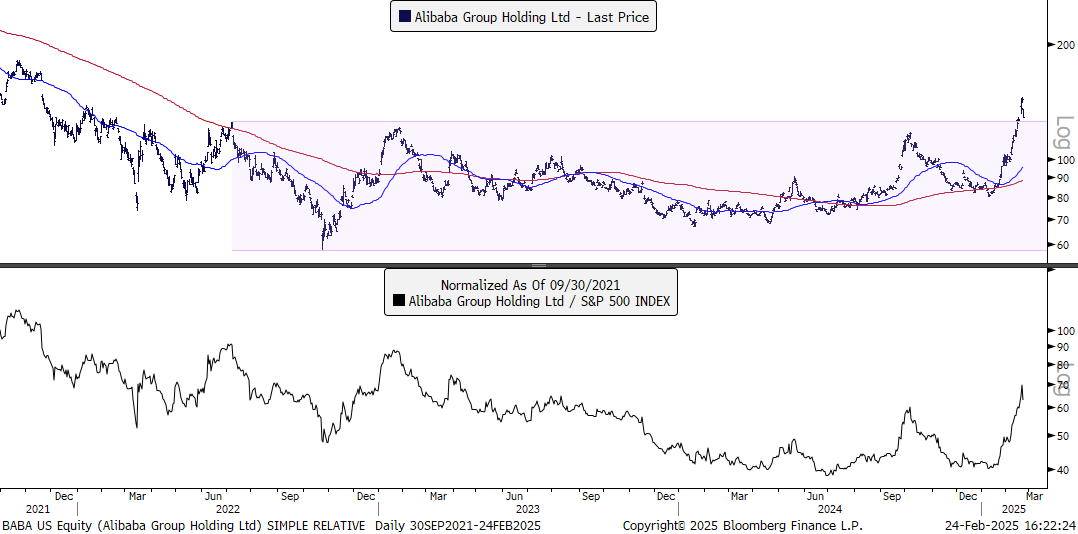
Source: Bloomberg; Data as of February 24, 2025. Past performance does not guarantee future results.
BYD Co. - BYDDY
BYDDY has a powerful combination in play: short term momentum with long term opportunity. On the back of >40% YTD move, BYDDY is breaking out of a 4-year trading range after getting rejected at resistance in the $83-85 zone multiple times. The stock may need to consolidate the sharp surge higher over the coming days and weeks, but this breakout to all-time highs after trading sideways for multiple years could be signs of longer-term trade in play.
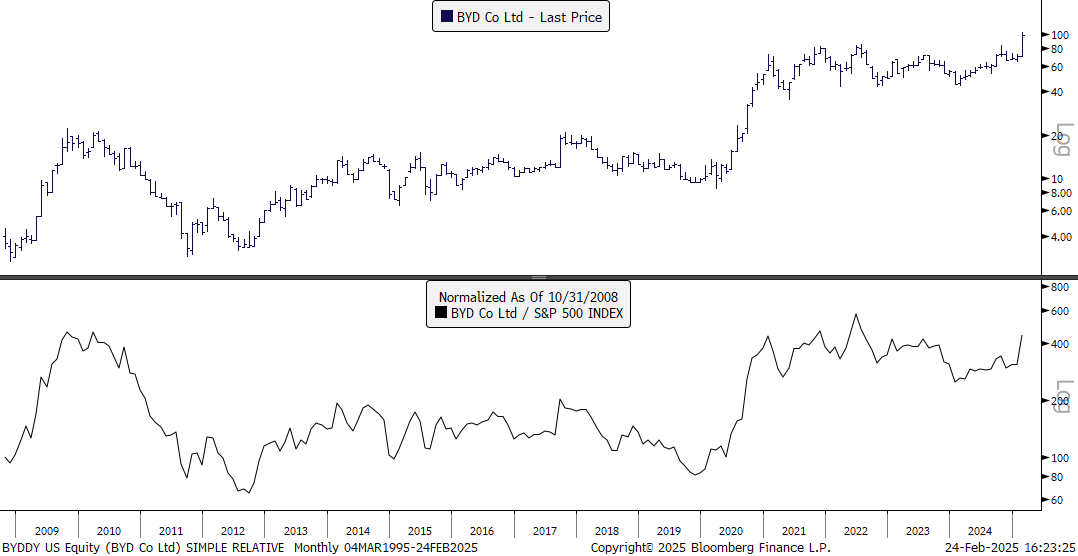
Source: Bloomberg; Data as of February 24, 2025. Past performance does not guarantee future results.
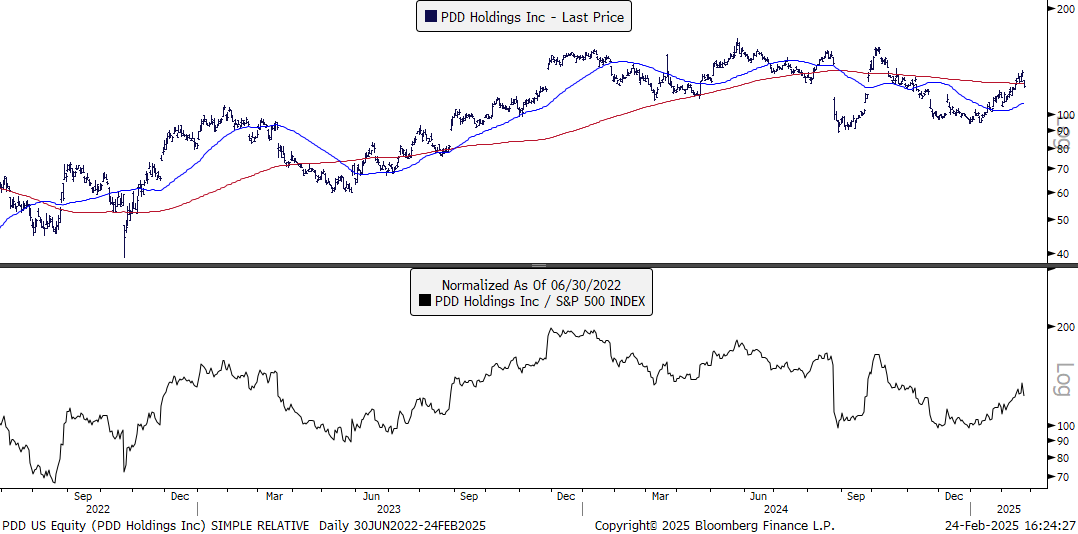
PDD Holdings- PDD
Since December 2023, PDD has struggled to mount consistent and durable momentum. Consequently, its trend has been slowly deteriorating while its relative performance over the S&P 500 has waned. Lately, the positives have been the higher lows from PDD as the stock now trades around its 200-day moving average. Sustained trading above the 200-day would be a step in the right direction, as would a cross of the 50-day above the 200-day. This would signal an improving trend.
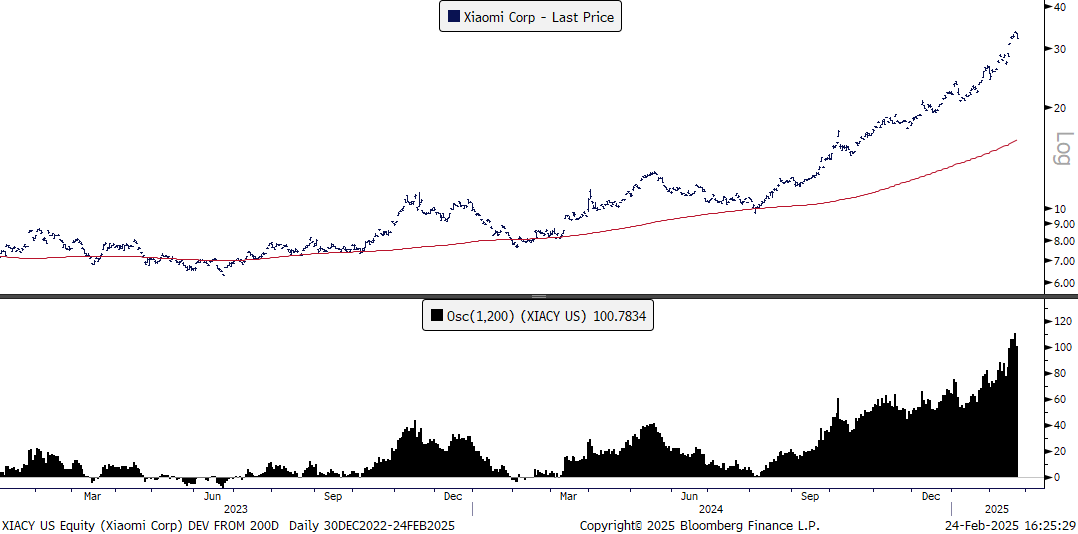
Xiaomi Corp - XIACY
Since its August 5 bear market low in 2024, XIACY has become an undisputed leader amongst Chinese ADRs in terms of price performance. The stock has rallied over 230% since the August low. There is elevated correction risk with XIACY trading roughly 100% above its 200-day moving average. However, any weakness could offer a buying opportunity.
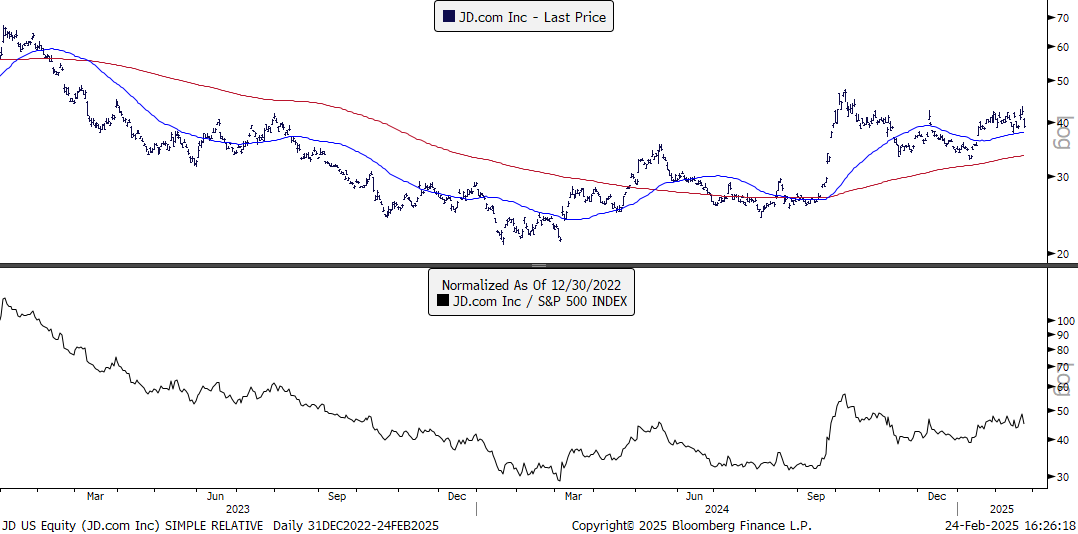
JD.com - JD
JD has been quietly carving out higher lows since early 2024. After an ~86% move from September 9 to October 7, 2024, JD has been trading sideways with its 50-day moving average above its 200-day moving average. A breakout and close above $43 would mark a potential reacceleration and would put the prior October 2024 high of ~47.80 in play.
Tencent - TCEHY
TCEHY is in a similar position to BABA. The stock is attempting to break out to multi-year highs after trading in a large base. TCEHY sustainably trading above 62.57 (the prior Oct’24 high) would be a bullish development with longer-term implications. While a test of any breakout may be needed, the improvement of TCEHY’s relative performance over the S&P 500 is helpful confirmation of potentially emerging strength.
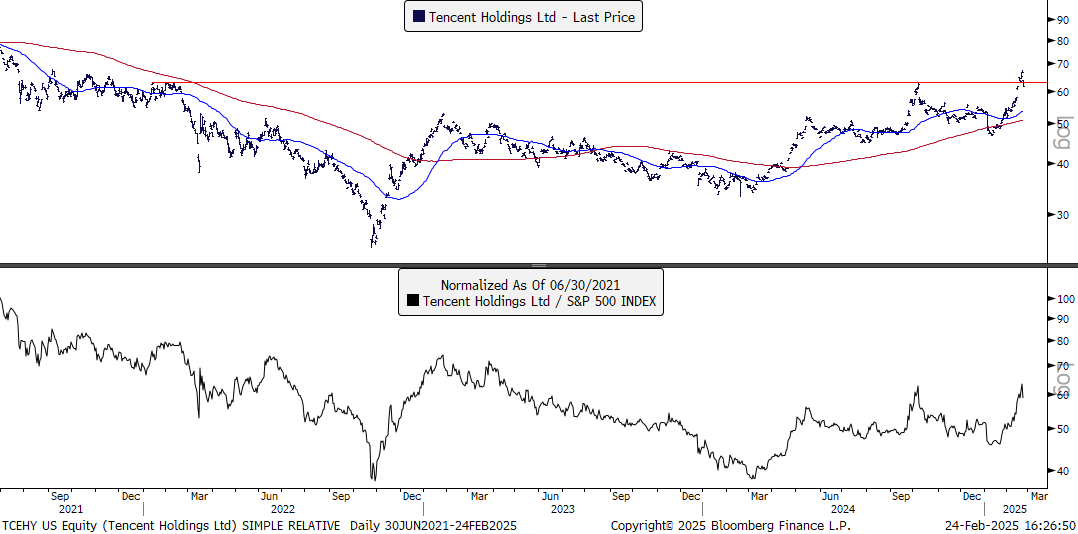
Source: Bloomberg; Data as of February 24, 2025. Past performance does not guarantee future results.
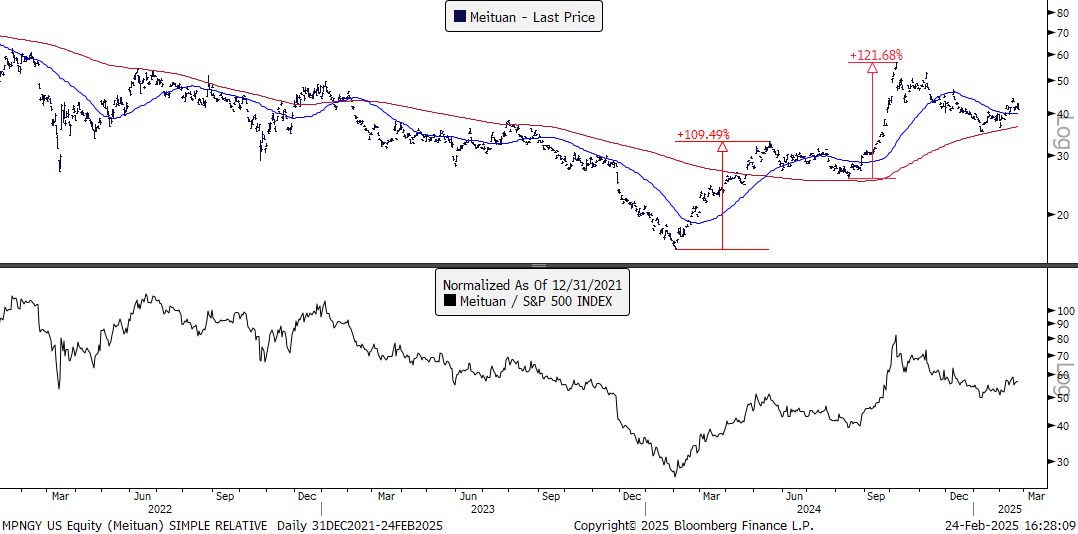
Meituan - MPNGY
MPNGY has experienced two meteoric rallies of ~110% and ~120% since its bear market low in February 2024. Following its first rally of ~110%, MPNGY paused for 60 trading days until rallying off the 200-day to begin the second rally of ~120%. MPNGY subsequently consolidated for 66 trading days and is now trading above its 50-day moving average. If prior price action is any indication, MPGNY could be on the verge of another leg higher. $44.15 is the first level of resistance to contend with.
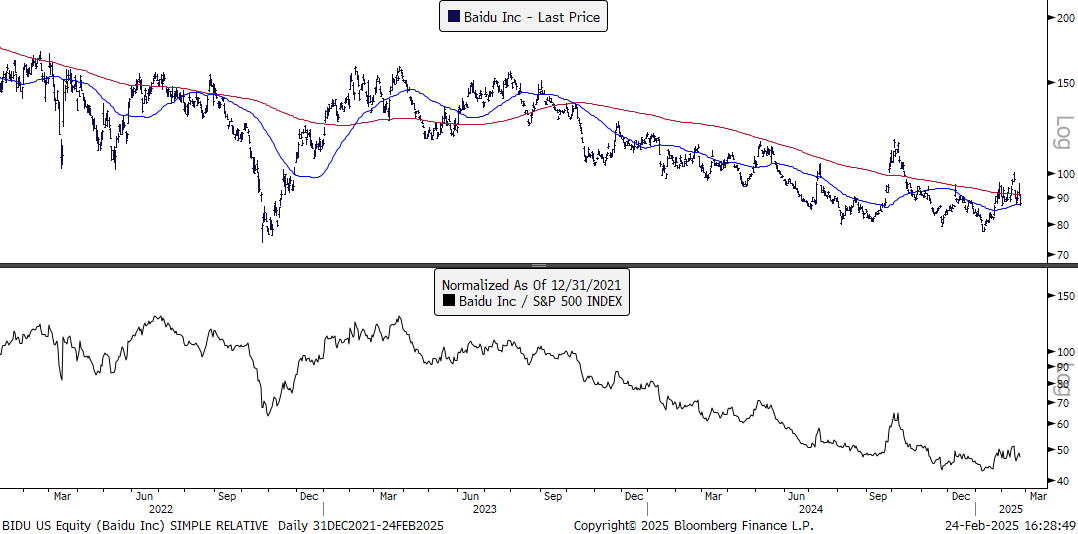
Baidu - BIDU
BIDU has struggled to mount any type of durable rally since late 2022. The downward slowing 200-day moving average has proven to be formidable resistance historically, with prior breakouts being quickly rejected. The positives for BIDU are the flattening out of its moving averages while no longer trading to new price lows. The 50-day moving average at ~86 marks immediate support for the stock, while a sustained breakout above $100 would signal further nuanced improvement.
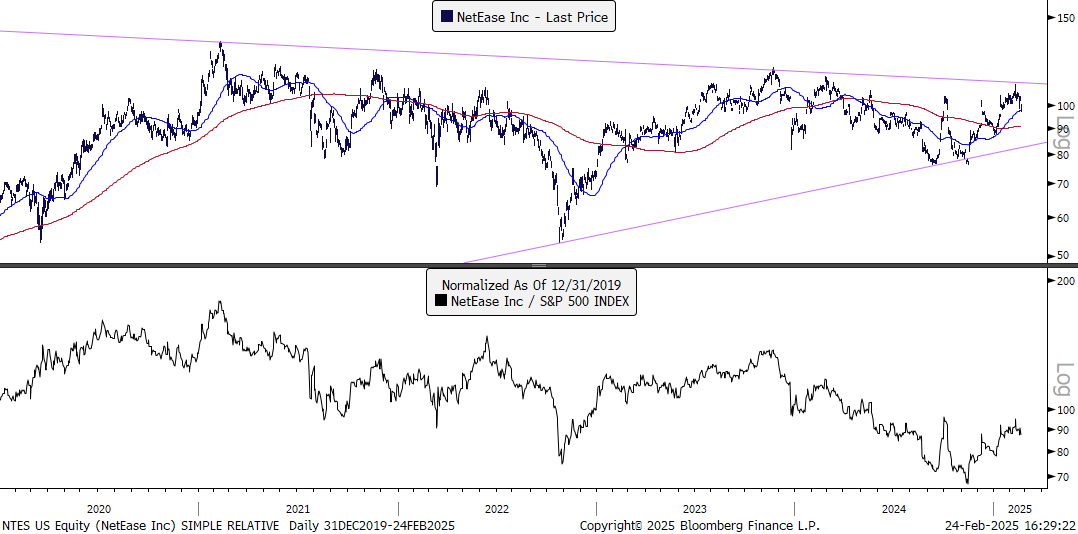
NetEase - NTES
NTES is at a compelling juncture. A breakout above longer-term resistance at $110 would be a bullish signal. Currently, NTES is consolidating at its rising 50-day moving average near $98, having served as reliable support recently. The improvement of its relative performance versus the S&P 500 paired with its positive responses to support has our attention. We’re monitoring NTES for a breakout here.
Why DRAG?
Despite fears of tariffs and trade wars, the Roundhill China Dragons ETF (DRAG) is trading to record highs amid strong momentum from its underlying constituents. The China Dragons collectively have a compelling combination of short term momentum with overall long-term attractive set-ups. As DeepSeek and other AI initiatives improve overall sentiment towards Chinese equities, we believe the China Dragons as a group are setting a positive tone for the broader China market, creating an attractive risk/reward opportunity for investors.
We believe the powerful combination of equal weighting and precise exposure to China’s innovative tech leaders provides a compelling value proposition over broader, diluted China investment alternatives in the marketplace.
For the holdings of DRAG, please click here.
Investors should consider the investment objectives, risks, charges, and expenses carefully before investing. For a prospectus or summary prospectus, if available, with this and other information about the Fund, please call 1-855-561-5728 or visit our website at www.roundhillinvestments.com/etf/DRAG. Read the prospectus or summary prospectus carefully before investing.
China Risk. The Fund’s significant investments in instruments that provide exposure to Chinese companies subject the Fund to risks specific to China. China may be subject to considerable degrees of economic, political and social instability. China is an emerging market and demonstrates significantly higher volatility from time to time in comparison to developed markets. Over the last few decades, the Chinese government has undertaken reform of economic and market practices and has expanded the sphere of private ownership of property in China. However, Chinese markets generally continue to experience inefficiency, volatility and pricing anomalies resulting from governmental influence, a lack of publicly available information and/or political and social instability.
Chinese companies are also subject to the risk that Chinese authorities can intervene in their operations and structure. Internal social unrest or confrontations with neighboring countries, including military conflicts in response to such events, may also disrupt economic development in China and result in a greater risk of currency fluctuations, currency non-convertibility, interest rate fluctuations and higher rates of inflation.
China has experienced security concerns, such as terrorism and strained international relations. Additionally, China is alleged to have participated in state-sponsored cyberattacks against foreign companies and foreign governments. Actual and threatened responses to such activity and strained international relations, including purchasing restrictions, sanctions, tariffs or cyberattacks on the Chinese government or Chinese companies, may impact China’s economy and Chinese issuers of securities in which the Fund invests. Incidents involving China’s or the region’s security may cause uncertainty in Chinese markets and may adversely affect the Chinese economy and the Fund’s investments. Export growth continues to be a major driver of China’s rapid economic growth. Reduction in spending on Chinese products and services, supply chain diversification, institution of additional tariffs or other trade barriers (including as a result of heightened trade tensions or a trade war between China and the U.S. or in response to actual or alleged Chinese cyber activity) or a downturn in any of the economies of China’s key trading partners may have an adverse impact on the Chinese economy. The Fund’s portfolio may include companies that are subject to economic or trade restrictions (but not investment restrictions) imposed by the U.S. or other governments due to national security, human rights or other concerns of such government. So long as these restrictions do not include restrictions on investments, the Fund is generally expected to invest in such companies.
Chinese companies are not subject to the same degree of regulatory requirements, accounting standards or auditor oversight as companies in more developed countries. As a result, information about the Chinese securities in which the Fund invests may be less reliable or complete. Chinese companies with securities listed on U.S. exchanges may be delisted if they do not meet U.S. accounting standards and auditor oversight requirements, which would significantly decrease the liquidity and value of the securities. There may be significant obstacles to obtaining information necessary for investigations into or litigation against Chinese companies, and shareholders may have limited legal remedies. Chinese companies may also be subject to significantly weaker recordkeeping requirements than the requirements imposed upon U.S. companies.
Market Risk. Market risk is the risk that a particular security, or Fund Shares in general, may fall in value. Securities are subject to market fluctuations caused by such factors as economic, political, regulatory or market developments, changes in interest rates and perceived trends in securities prices.
Derivatives Risk. The use of derivative instruments (i.e. swap agreements and forward contracts) involves risks different from, or possibly greater than, the risks associated with investing directly in securities and other traditional investments. These risks include: (i) the risk that the counterparty to a derivative transaction may not fulfill its contractual obligations; (ii) risk of mispricing or improper valuation; and (iii) the risk that changes in the value of the derivative may not correlate perfectly with the underlying asset.
Active Management Risk. The Fund is actively-managed and its performance reflects investment decisions that the Adviser and/or Sub-Adviser makes for the Fund.
Depositary Receipts Risk. Depositary receipts may be less liquid than the underlying shares in their primary trading market. Any distributions paid to the holders of depositary receipts are usually subject to a fee charged by the depositary. Holders of depositary receipts may have limited voting rights, and investment restrictions in certain countries.
Swap Agreements Risk. The Fund may utilize swap agreements to derive its exposure to one or more of the China Dragons. Swap agreements may involve greater risks than direct investment in securities as they may be leveraged and are subject to credit risk, counterparty risk and valuation risk.
Consumer Discretionary Sector Risk. Consumer discretionary companies, such as retailers, media companies and consumer services companies, provide non-essential goods and services. These companies manufacture products and provide discretionary services directly to the consumer, and the success of these companies is tied closely to the performance of the overall domestic and international economy, interest rates, competition and consumer confidence. Success depends heavily on disposable household income and consumer spending.
Information Technology Companies Risk. Information technology companies face intense competition, both domestically and internationally, which may have an adverse effect on profit margins. Like other technology companies, information technology companies may have limited product lines, markets, financial resources or personnel. The products of information technology companies may face obsolescence due to rapid technological developments, frequent new product introduction, unpredictable changes in growth rates and competition for the services of qualified personnel.
Large Capitalization Risk. Large capitalization companies may be less able than smaller capitalization companies to adapt to changing market conditions.
New Fund Risk. The Fund is a recently organized investment company with a limited operating history. As a result, prospective investors have a limited track record or history on which to base their investment decision.
Non-Diversification Risk. As a "non-diversified" fund, the Fund may hold a smaller number of portfolio securities than many other funds.
Concentration Risk. The Fund is concentrated in the industry or group of industries comprising the consumer discretionary sector and communication services sector.
Roundhill Financial Inc. serves as the investment advisor. The Funds are distributed by Foreside Fund Services, LLC which is not affiliated with Roundhill Financial Inc., U.S. Bank, or any of their affiliates.
Glossary:
S&P 500: The S&P 500® is widely regarded as the best single gauge of large-cap U.S. equities and serves as the foundation for a wide range of investment products. The index includes 500 leading companies and captures approximately 80% coverage of available market capitalization.
Breakout: A breakout is when the price of an asset moves above a resistance area, or moves below a support area. Breakouts indicate the potential for the price to start trending in the breakout direction. For example, a breakout to the upside from a chart pattern could indicate the price will start trending higher.
Breakdown: A breakdown is a downward move in a security's price, usually through an identified level of support, that portends further declines. A breakdown commonly occurs on heavy volume and the subsequent move lower tends to be quick in duration and severe in magnitude.
Resistance: Resistance is one of the foundational elements of technical analysis (along with its corollary: support). Resistance is a price or price zone above the current market that contains the upside movement of an asset. Resistance is where selling interest appears over time, blocking further upside progress.
Support: A support level is the price level that an asset doesn't fall below for a period of time. An asset's support level is created by buyers entering the market whenever the asset dips to a lower price.
50-Day Moving Average: A simple moving average is constructed by taking a mean average of a time series (50-day) over a given period of time. Moving average often provides a better indicator of trends.
200-Day Moving Average: A simple moving average is constructed by taking a mean average of a time series (200-day) over a given period of time. Moving average often provides a better indicator of trends.
Relative Performance (Return): Relative performance is the return an asset achieves over a period of time compared to a benchmark. The relative return is the difference between the asset’s return and the return of the benchmark.
Uptrend: An uptrend describes the price movement of a financial asset when the overall direction is upward. In an uptrend, each successive peak and trough is higher than the ones found earlier in the trend. The uptrend is therefore composed of higher swing lows and higher swing highs. As long as the price is making these higher swing lows and higher swing highs, the uptrend is considered intact.
Downtrend: A downtrend is a gradual reduction in the price or value of a stock or commodity, or the activity of a financial market. A downtrend can be contrasted with an uptrend.