What Are Meme Stocks?
Meme stocks are public companies whose prices are influenced as much (or more) by social media attention and online communities as by traditional business fundamentals. They can surge or fall rapidly as narratives catch fire, sentiment shifts, and trading flows respond. This guide explains what meme stocks are, why they move the way they do, and what attracts investors to them.
What Counts as a “Meme Stock”?
A stock becomes “meme-like” when conversation drives participation. Reddit, Discord, X, YouTube, and other communities can elevate a name from obscurity to ubiquity in days. These episodes are usually marked by unusual trading activity, fast-moving narratives, and a highly engaged retail base. While any company can trend online, meme stocks often sit at the intersection of a simple story, visible controversy (such as high short interest), and a catalyst that gets people excited.
A low share price could be an impactful catalyst for the makings of a meme stock as well. Since the mid-1990s, the average price of an S&P 500 stock has been rising, recently hitting an all-time high of $228 on 8/26/25.

When comparing the average stock price for members of the S&P 500, Nasdaq 100, and a basket of meme stocks, the disparity is stark. While the Nasdaq 100 and S&P 500 sport an average constituent price in the triple digits, the average meme stock price is just $22.41.

Why Do Meme Stocks Move?
At the core is attention. A spark, such as an earnings headline, a product rumor, a viral post pulls new eyes to a ticker. As the stock begins to move, more posts appear, watchlists grow, and the crowd reinforces its own enthusiasm. This attention flywheel can be powerful on the way up and equally unforgiving on the way down when the conversation fades.
Positioning can help amplify the move. When short interest is elevated, rising prices may pressure short sellers to buy back shares to close positions, adding demand to a rally. That buy-to-cover cycle is the basic short squeeze dynamic. Options activity can add another layer. Heavy call buying often leads market makers to hedge by purchasing the underlying shares, and as prices climb, hedging demand can increase, often referred to as a “gamma squeeze.” The same mechanics can cut the other way when sentiment turns: put activity and unwinds can accelerate declines.
Liquidity finishes the picture. Many meme stocks have relatively tight floats or ownership that concentrates supply. In those conditions, each marginal order can have outsize impact, especially outside regular trading hours. Liquidity that felt ample during the ascent can evaporate when the narrative cools, turning exits into a slog.
Catalysts are the guideposts that keep attention tethered: earnings and guidance, product launches, leadership changes, regulatory headlines, even theme-level developments (AI, robotics, energy). When catalysts continue and the story evolves, episodes can extend. When the story stalls, momentum often does too.
“I Just Like the Stock”
The meme-stock phenomenon erupted in 2020–2021 as retail investors, mobilized on forums like Reddit’s r/WallStreetBets and inspired by Keith Gill’s online alias Roaring Kitty, targeted heavily shorted names such as GameStop (GME) and AMC Entertainment (AMC). Fueled by mantras like “diamond hands” and “hold the line,” retail investors catalyzed historic short squeezes that sent prices vertical and forced rapid covering by bearish institutional funds. While this Main Street versus Wall Street period has faded, the lesson endures: retail investors can potentially catalyze meteoric price action and sharp upticks in volatility in ignored and shunned corners of the equity market.
The Staying Power of the Retail Investor
Retail participation has become a structural feature of equity markets. Zero-commission trading, fractional shares, mobile access, and a constant flow of real-time information lowered barriers and made investing communal. Ideas travel faster; communities coalesce overnight. That backdrop helps explain why meme-style bursts recur in waves rather than disappearing entirely.
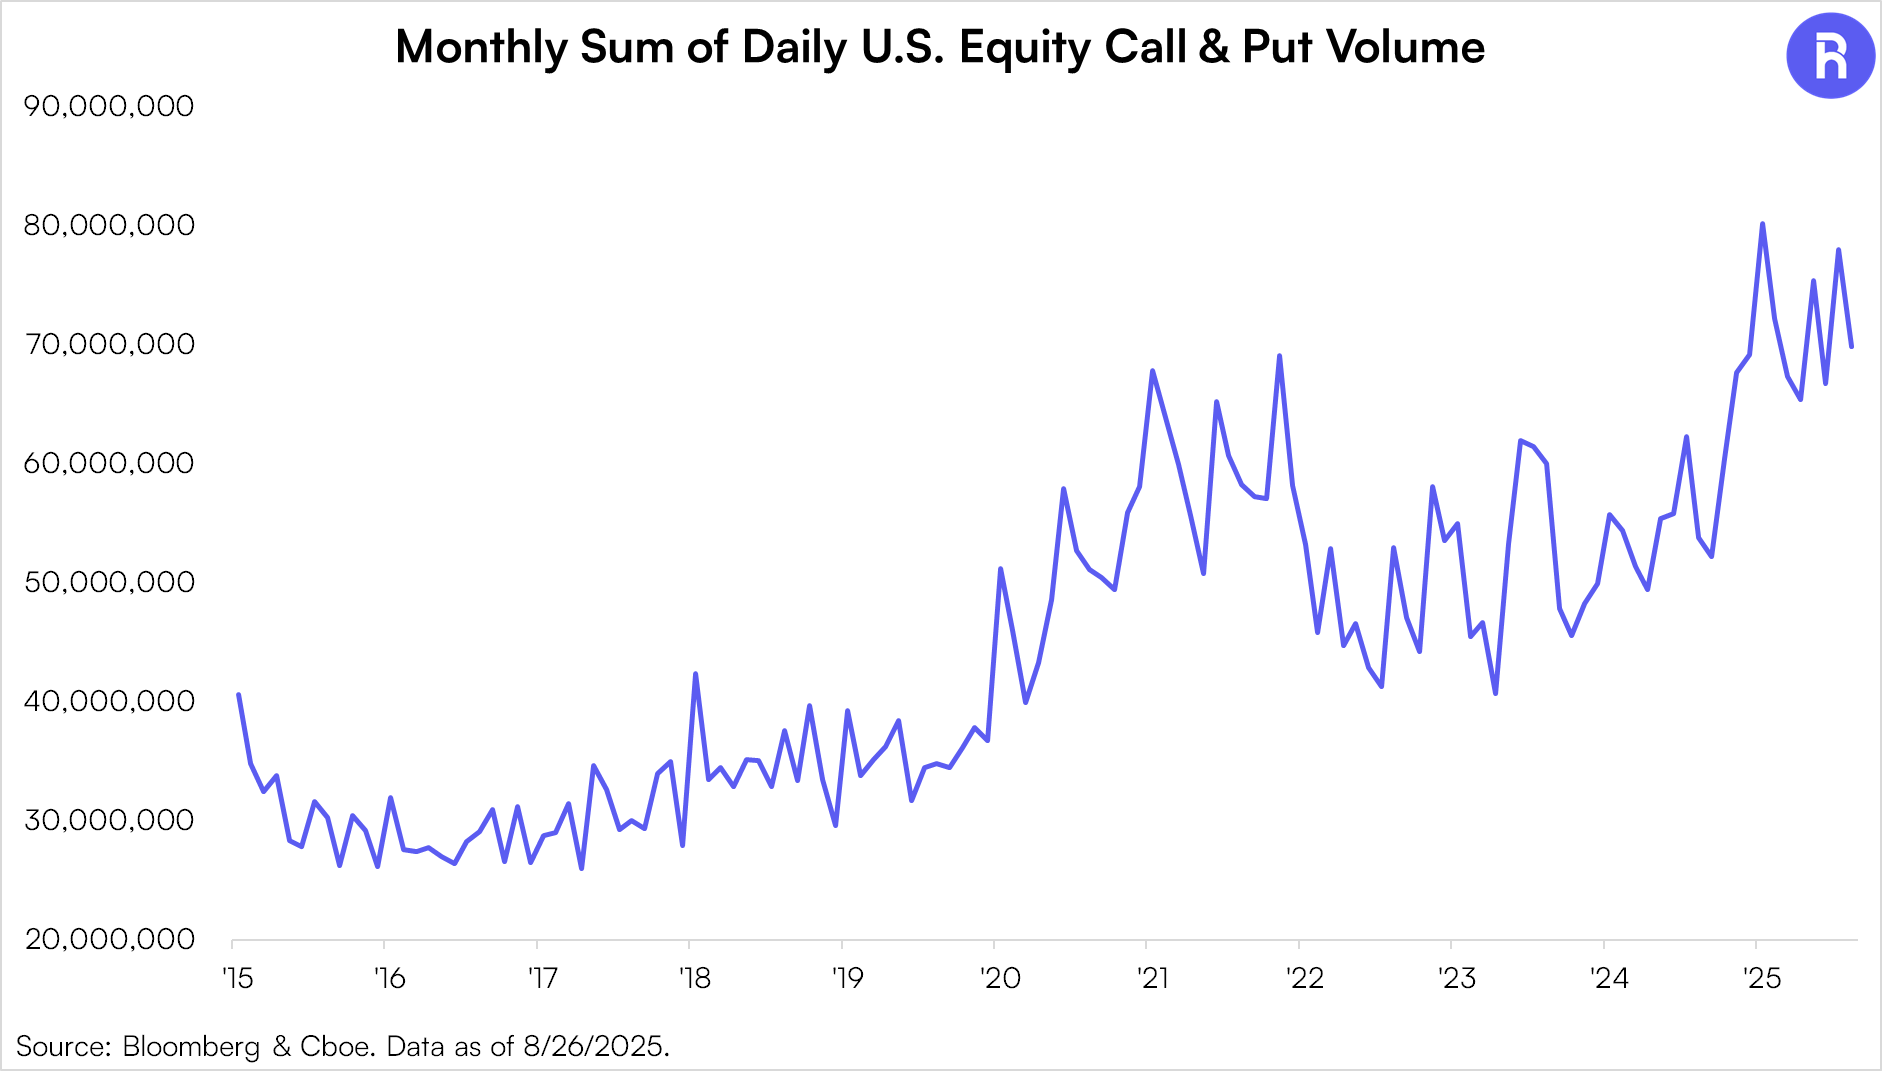
Interestingly, equity options volume has also seen a sharp pick-up in activity since the pandemic and appears to be settling at a higher baseline level of activity. This has coincided with increased retail participation that captivated investors in 2020 and 2021.
Why an Active Approach Can Shine
Meme stocks live at the intersection of attention, positioning, and liquidity, which is an environment that rarely rewards autopilot. An active investment style can lean into that reality: continuously reassessing narratives, monitoring positioning and options dynamics, and adjusting exposure as liquidity and sentiment shift. The aim isn’t to predict every swing, but to be adaptive. In fast, feedback-loop markets, that kind of agility may be the difference between simply watching volatility and working to harness it.
Bottom Line
Meme stocks are a feature of modern markets—the meeting point of social attention, positioning, and accessible trading. For those exploring the space, a disciplined, dynamic approach—with clear sizing, timelines, and risk controls—can be critical given boom-and-bust tendencies.
Glossary:
A meme stock refers to the shares of a company that have gained viral popularity due to heightened social sentiment. This is usually due to activity online and particularly on social media platforms. These online communities can dedicate heavy research and resources toward a particular stock. Meme stocks often have heavier discourse and analysis in discussion threads on websites like Reddit and posts on platforms such as X (formerly Twitter) and Facebook.
The S&P 500® is widely regarded as the best single gauge of large-cap U.S. equities and serves as the foundation for a wide range of investment products. The index includes 500 leading companies and captures approximately 80% coverage of available market capitalization.
The NASDAQ-100 Index is a modified capitalization-weighted index of the 100 largest and most active non-financial domestic and international issues listed on the NASDAQ. No security can have more than a 24% weighting. The index was developed with a base value of 125 as of February 1, 1985. Prior to December 21,1998 the Nasdaq 100 was a cap-weighted index.This information is provided solely as general investment education. None of the information provided should be regarded as a suggestion to engage in or refrain from any investment related course of action. Investing involves risk, loss of principal is possible.
Not an offer: This document does not constitute advice or a recommendation or offer to sell or a solicitation to deal in any security or financial product. It is provided for information purposes only and on the understanding that the recipient has sufficient knowledge and experience to be able to understand and make their own evaluation of the proposals and services described herein, any risks associated therewith and any related legal, tax, accounting or other material considerations. To the extent that the reader has any questions regarding the applicability of any specific issue discussed above to their specific portfolio or situation, prospective investors are encouraged to contact 1-855-561-5728 or consult with the professional advisor of their choosing.
Forward-looking statements: Certain information contained herein constitutes “forward-looking statements,” which can be identified by the use of forward-looking terminology such as “may,” “will,” “should,” “expect,” “anticipate,” “project,” “estimate,” “intend,” “continue,” or “believe,” or the negatives thereof or other variations thereon or comparable terminology. Due to various risks and uncertainties, actual events, results or actual performance may differ materially from those reflected or contemplated in such forward-looking statements. Nothing contained herein may be relied upon as a guarantee, promise, assurance or a representation as to the future.
Use of Third-party Information: Certain information contained herein has been obtained from third party sources and such information has not been independently verified by Roundhill Financial Inc. No representation, warranty, or undertaking, expressed or implied, is given to the accuracy or completeness of such information by Roundhill Financial Inc. or any other person. While such sources are believed to be reliable, Roundhill Financial Inc. does not assume any responsibility for the accuracy or completeness of such information. Roundhill Financial Inc. does not undertake any obligation to update the information contained herein as of any future date.
Any indices and other financial benchmarks shown are provided for illustrative purposes only, are unmanaged, reflect reinvestment of income and dividends and do not reflect the impact of advisory fees. Investors cannot invest directly in an index.
Except where otherwise indicated, the information contained in this presentation is based on matters as they exist as of the date of preparation of such material and not as of the date of distribution or any future date. Recipients should not rely on this material in making any future investment decision. The performance data quoted represents past performance. Past performance does not guarantee future results. Current performance may be lower or higher than the performance data quoted.