A Look Back at 2025
Stocks in 2025 were defined by tariff fears, expectations on the Federal Reserve easing cycle, the resiliency of the AI trade, and continued concentration concerns around the market heavyweights. Yet beneath the noise, the market spent much of the year rotating rather than breaking, a pattern that often characterizes the middle innings of a bull market, not the end of one.
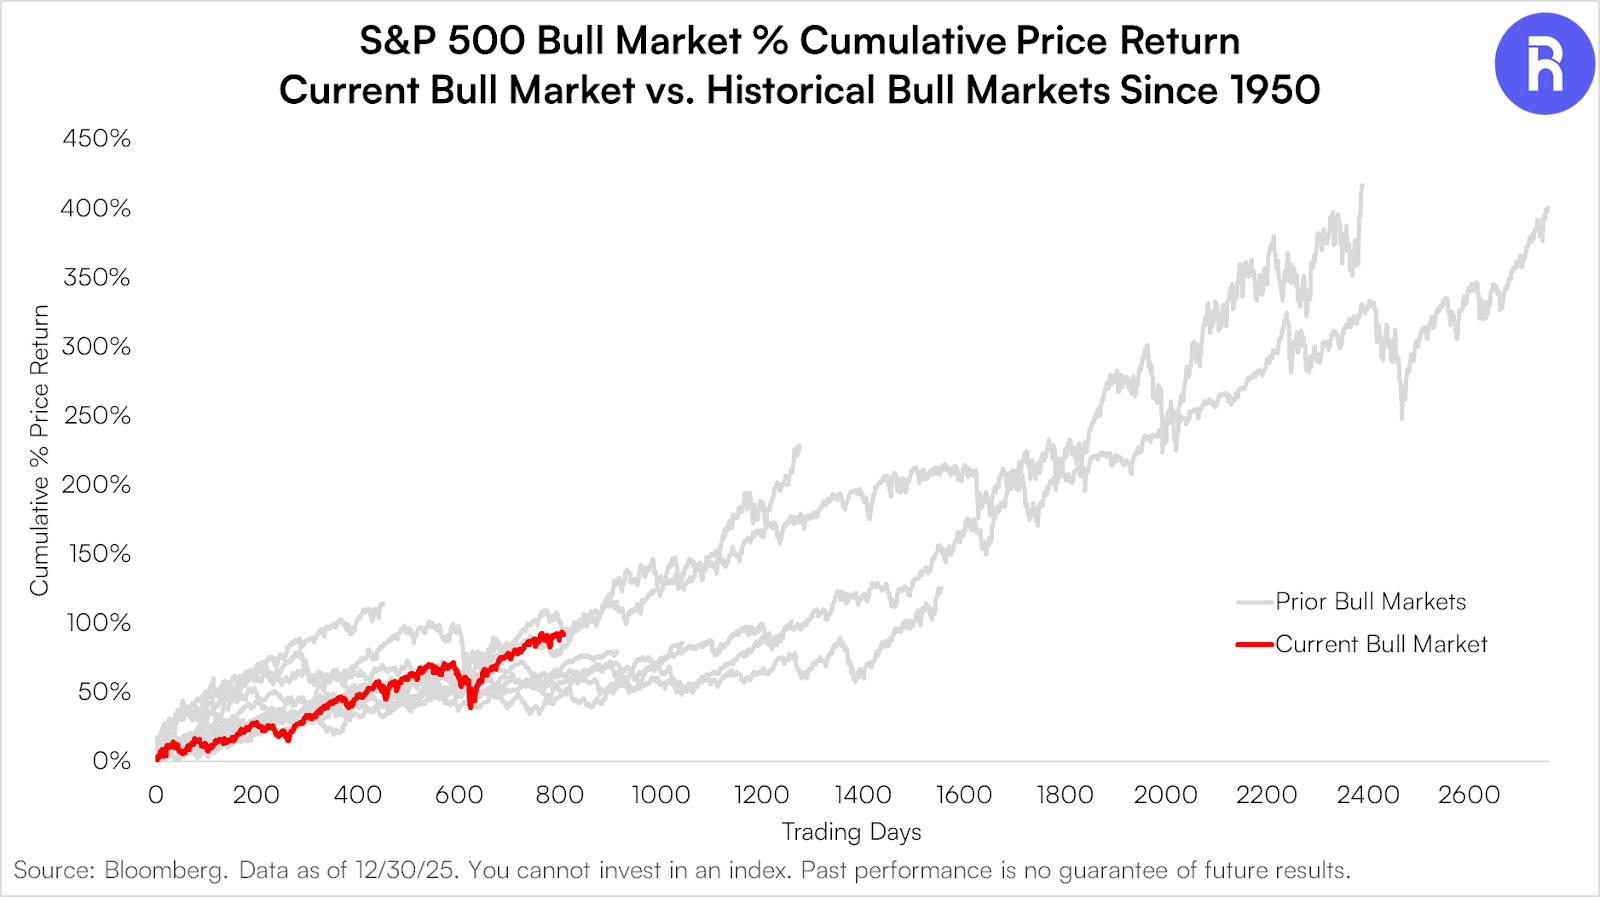
Despite persistent macro noise, the bull market appears intact. To-date, the current bull market has registered a return of 92.3% over the course of roughly 39 months, shy of the average bull market (since 1950) which returns 158.2% over 58 months.*
From a technical perspective, the market appears to show signs of resilience as we kick off 2026.
Is Market Breadth Deteriorating?
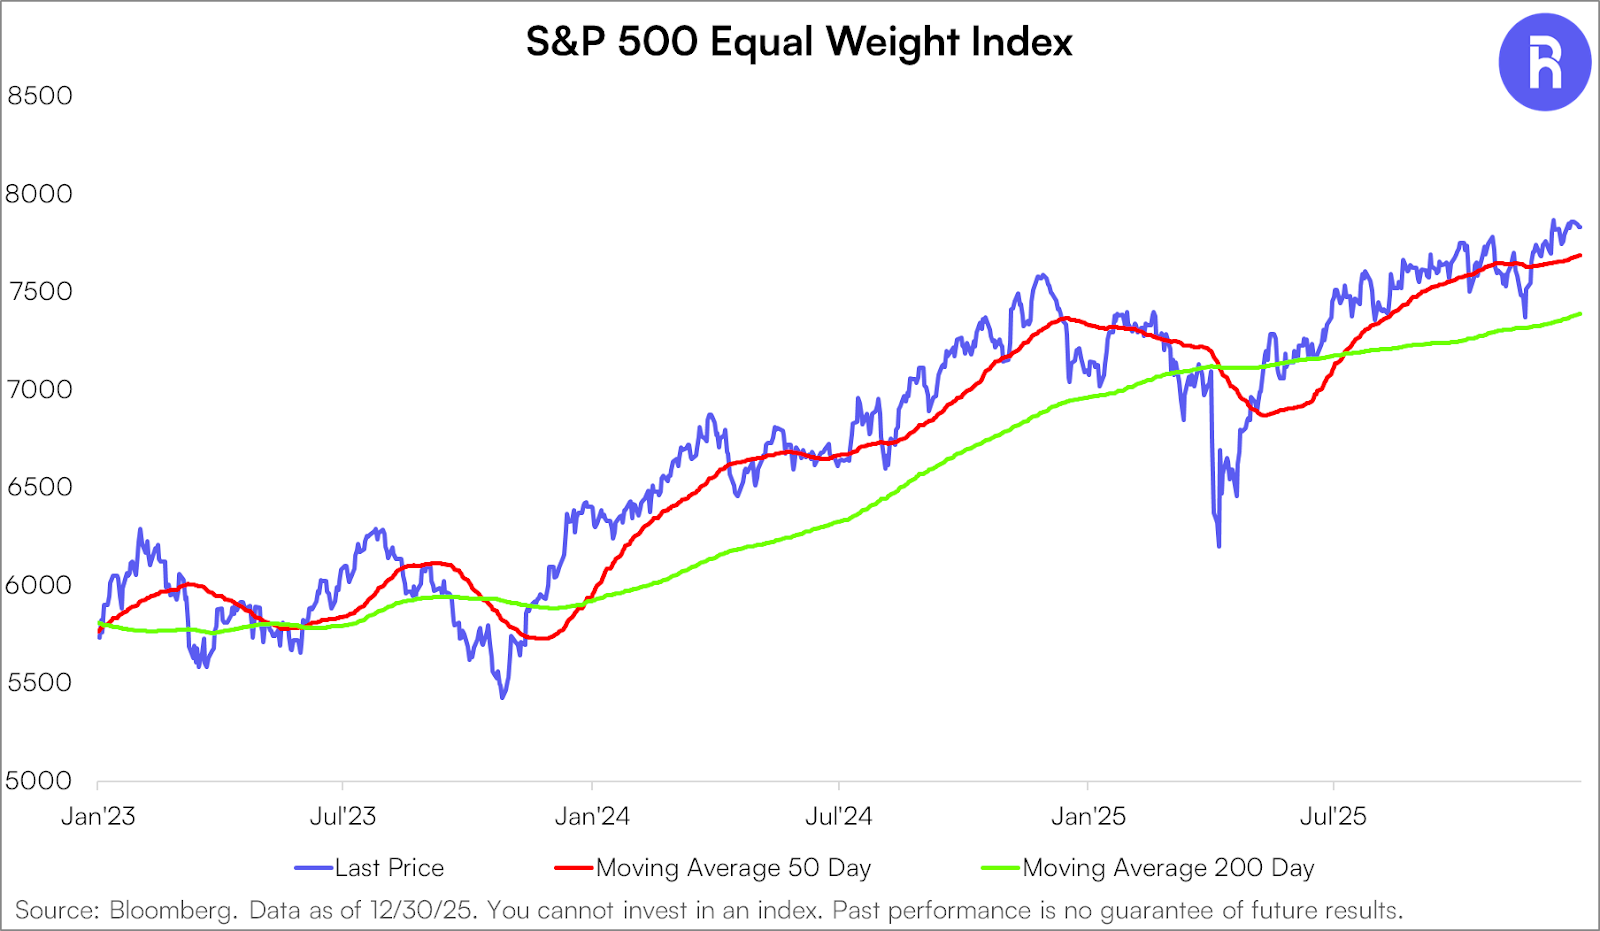
Concerns around weakening breadth have grown louder over the past six months, but the data does not yet support that narrative. While the S&P 500 Index and Magnificent Seven have been trading sideways since late October, the equal weight S&P 500 Index traded to all-time highs in December. Even the more cyclically-sensitive Russell 2000 Index traded to record highs in mid-December. If participation were truly deteriorating, the average stock would likely not be hovering near record levels.
Watching the 200-Day Moving Average
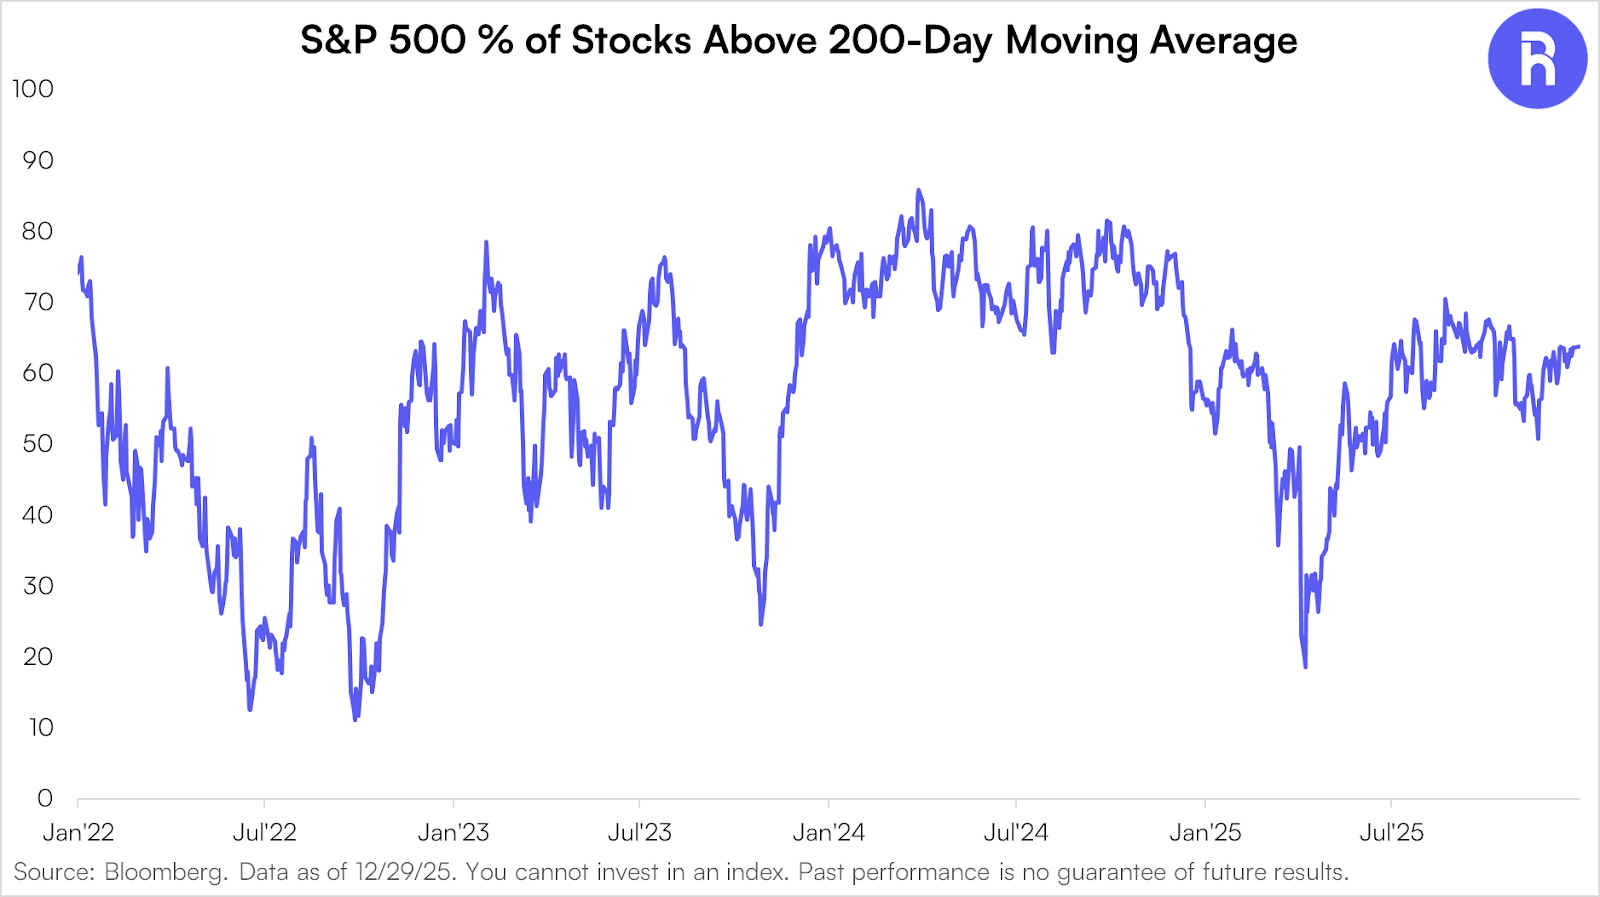
One indicator we continue to monitor closely is the percentage of stocks trading above their 200-day moving average. This measure may offer a clean read on how broad the market’s uptrend really is.
Along with supportive market participation, the trend backdrop for U.S. stocks is still supportive. Currently, 64% of the S&P 500 trade above their respective 200-day moving average. While not the best reading we’ve ever seen, this is far from a bearish reading. What will matter going forward is how this series moves over coming months. If the S&P 500 pushes to fresh all-time highs while this series begins to fall, this would insinuate that less stocks are in uptrends and supporting the ongoing market rally (i.e. narrowing participation). If the % of stocks trading above their 200-day moving average rises as the market moves higher, more stocks are participating and the trend backdrop can be thought of as healthy.
What matters is direction. Rising participation alongside higher prices would reinforce trend strength, while divergence would be an early sign of narrowing leadership.
In short, internal trends are acting as a stabilizer, not a stress signal.
Cyclicals vs. Defensives: What Leadership Is Saying
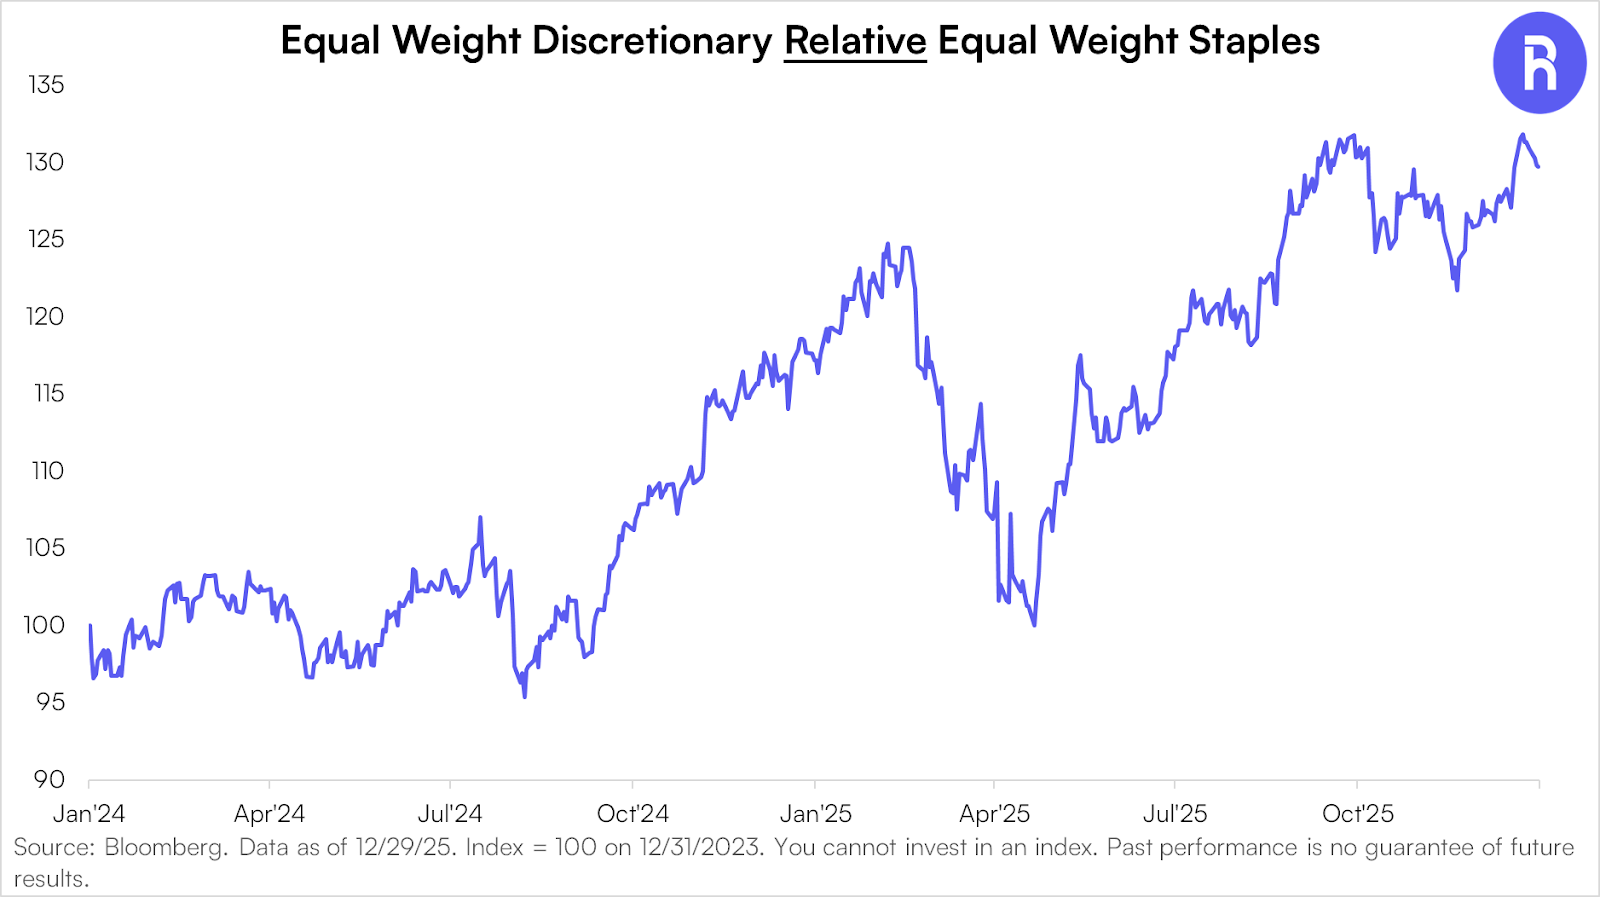
On an equally-weighted basis, Consumer Discretionary stocks remain in favor over Consumer Staples stocks. Currently, Discretionary has outpaced Staples by 21% since April 9. While the relative ratio is off its YTD highs, the backdrop of healthy risk appetite in a supportive trend environment means any weakness deserves the benefit of the doubt. Pervasive weakness and fresh lows in Discretionary stocks relative to Staples stocks would be a change of tone and a potential red flag. At present, this relationship does not point to investors meaningfully shifting into defense.
Looking Ahead to 2026
2026 trading is underway. Gold** finished 2025 on the front foot, registering an annual return of over 65%, its best year in over forty years and strongest return versus stocks since 2008. Interestingly enough, 2025 marked the third consecutive year in which both S&P 500 and Gold recorded double digit returns. While history offers limited guidance here, it does suggest that gains going forward may be harder-earned.
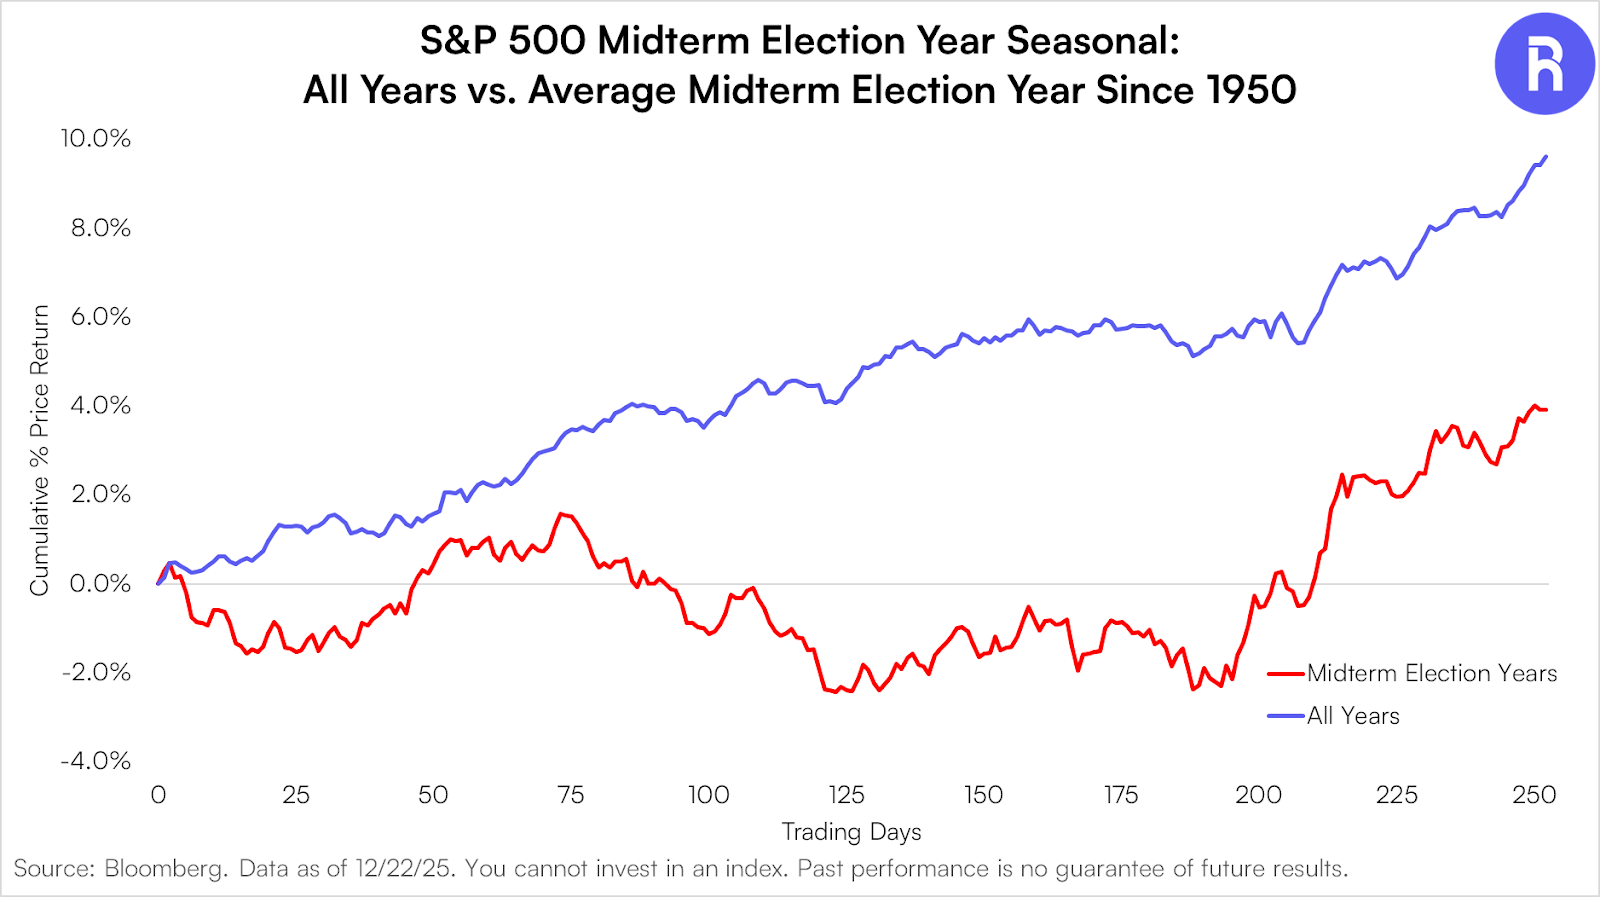
Another consideration for 2026 is that it is a U.S. midterm election year. Historically, midterm election years have been associated with choppier equity markets, driven largely by policy uncertainty and shifting expectations around which party will control Congress. That uncertainty can weigh on sentiment and price action until after Election Day in November, when voting results provide clarity for investors.
Bottom Line
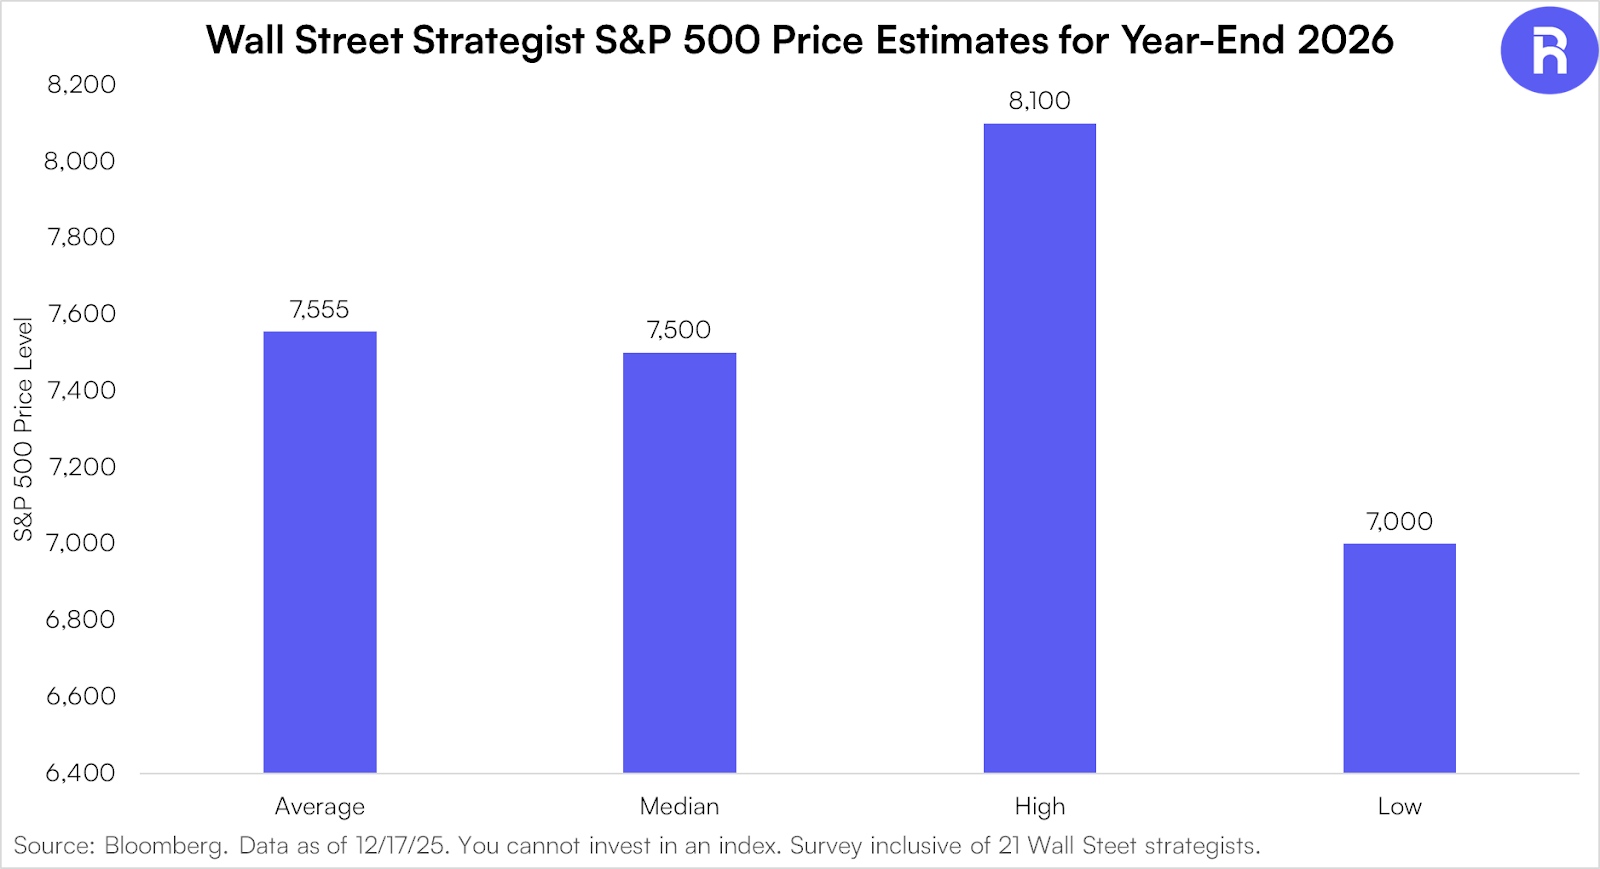
Taken together, the technical picture suggests an equity market that is consolidating gains rather than deteriorating internally. Breadth seems in better shape than commonly believed, cyclical equities continue to be rewarded, and leadership appears to be rotating rather than retreating. Generally, a Bloomberg survey of Wall Street strategists implies the street is broadly constructive on 2026, with the average S&P 500 year-end target of 7,555, implying roughly 10% upside from current levels.
After three straight years of strong returns, investors may grow quicker to hedge and quicker to question rallies. That’s normal. What would matter more is a clear breakdown in breadth or leadership. We’re not seeing that yet.
With the market near all-time highs in a supportive trend environment, the market appears to be in a healthy position where weakness can be viewed opportunistically.
*This study encapsulates all S&P 500 index bull markets since 1950. Bull markets shown represent S&P 500 price appreciation periods measured from market trough to subsequent peak. Bull market date ranges include: 10/22/1957–12/12/1961; 6/26/1962–2/9/1966; 10/7/1966–11/29/1968; 5/26/1970–1/11/1973; 10/3/1974–11/28/1980; 8/12/1982–8/25/1987; 12/4/1987–7/16/1990; 10/11/1990–3/24/2000; 10/9/2002–10/9/2007; 3/9/2009–2/19/2020; 3/23/2020–1/3/2022; and 10/12/2022–12/31/2025.
**Bloomberg’s proxy for Gold is GOLDS Comdty.
Glossary
The S&P 500® is widely regarded as the best single gauge of large-cap U.S. equities and serves as the foundation for a wide range of investment products. The index includes 500 leading companies and captures approximately 80% coverage of available market capitalization.
The S&P 500® Equal Weight Index is the equal-weight version of the widely-used S&P 500. The index includes the same constituents as the capitalization weighted S&P 500, but each company in the S&P 500 EWI is allocated a fixed weight - or 0.2% of the index total at each quarterly rebalance.
The Russell 2000 Index is comprised of the smallest 2000 companies in the Russell 3000 Index, representing approximately 8% of the Russell 3000 total market capitalization.
The Magnificent Seven stocks are the most influential companies in the U.S. stock market. This term has been popularized to describe a set of dominant companies, particularly in the tech sector. The group currently includes Alphabet, Amazon, Apple, Tesla, Meta Platforms, Microsoft, and Nvidia, and spans four sectors: technology services, electronic technology, retail trade, and consumer durables. It operates across these industries: internet software/services, telecommunications equipment, internet retail, packaged software, semiconductors, and motor vehicles.
A bull market is a market that is on the rise and where the conditions of the economy are generally favorable.
This information is provided solely as general investment education. None of the information provided should be regarded as a suggestion to engage in or refrain from any investment related course of action. Investing involves risk, loss of principal is possible.
Not an offer: This document does not constitute advice or a recommendation or offer to sell or a solicitation to deal in any security or financial product. It is provided for information purposes only and on the understanding that the recipient has sufficient knowledge and experience to be able to understand and make their own evaluation of the proposals and services described herein, any risks associated therewith and any related legal, tax, accounting or other material considerations. To the extent that the reader has any questions regarding the applicability of any specific issue discussed above to their specific portfolio or situation, prospective investors are encouraged to contact 1-855-561-5728 or consult with the professional advisor of their choosing.
Forward-looking statements: Certain information contained herein constitutes “forward-looking statements,” which can be identified by the use of forward-looking terminology such as “may,” “will,” “should,” “expect,” “anticipate,” “project,” “estimate,” “intend,” “continue,” or “believe,” or the negatives thereof or other variations thereon or comparable terminology. Due to various risks and uncertainties, actual events, results or actual performance may differ materially from those reflected or contemplated in such forward-looking statements. Nothing contained herein may be relied upon as a guarantee, promise, assurance or a representation as to the future.
Use of Third-party Information: Certain information contained herein has been obtained from third party sources and such information has not been independently verified by Roundhill Financial Inc. No representation, warranty, or undertaking, expressed or implied, is given to the accuracy or completeness of such information by Roundhill Financial Inc. or any other person. While such sources are believed to be reliable, Roundhill Financial Inc. does not assume any responsibility for the accuracy or completeness of such information. Roundhill Financial Inc. does not undertake any obligation to update the information contained herein as of any future date.
Any indices and other financial benchmarks shown are provided for illustrative purposes only, are unmanaged, reflect reinvestment of income and dividends and do not reflect the impact of advisory fees. Investors cannot invest directly in an index.
Except where otherwise indicated, the information contained in this presentation is based on matters as they exist as of the date of preparation of such material and not as of the date of distribution or any future date. Recipients should not rely on this material in making any future investment decision. The performance data quoted represents past performance. Past performance does not guarantee future results. Current performance may be lower or higher than the performance data quoted.
Investing involves risk. Principal loss is possible.
Investors should consider the investment objectives, risk, charges and expenses carefully before investing. For a prospectus or summary prospectus with this and other information about Roundhill ETFs please call 1-855-561-5728 or visit the website at www.roundhillinvestments.com/etf. Read the prospectus or summary prospectus carefully before investing.
Roundhill Financial Inc. serves as the investment advisor. The Funds are distributed by Foreside Fund Services, LLC which is not affiliated with Roundhill Financial Inc., U.S. Bank, or any of their affiliates.