The BIG Picture - Why the Magnificent Seven are Magnificent
At this point, everyone knows that seven stocks have contributed nearly all (73% to be exact) of the S&P 500 Index’s year-to-date return. Most also know that these names have been labeled the “Magnificent Seven” – Alphabet, Amazon, Apple, Meta, Microsoft, NVIDIA, and Tesla. On average, these seven tech leaders are up 99% on the year, while the S&P 500 Index is up a more modest yet still robust 21%.
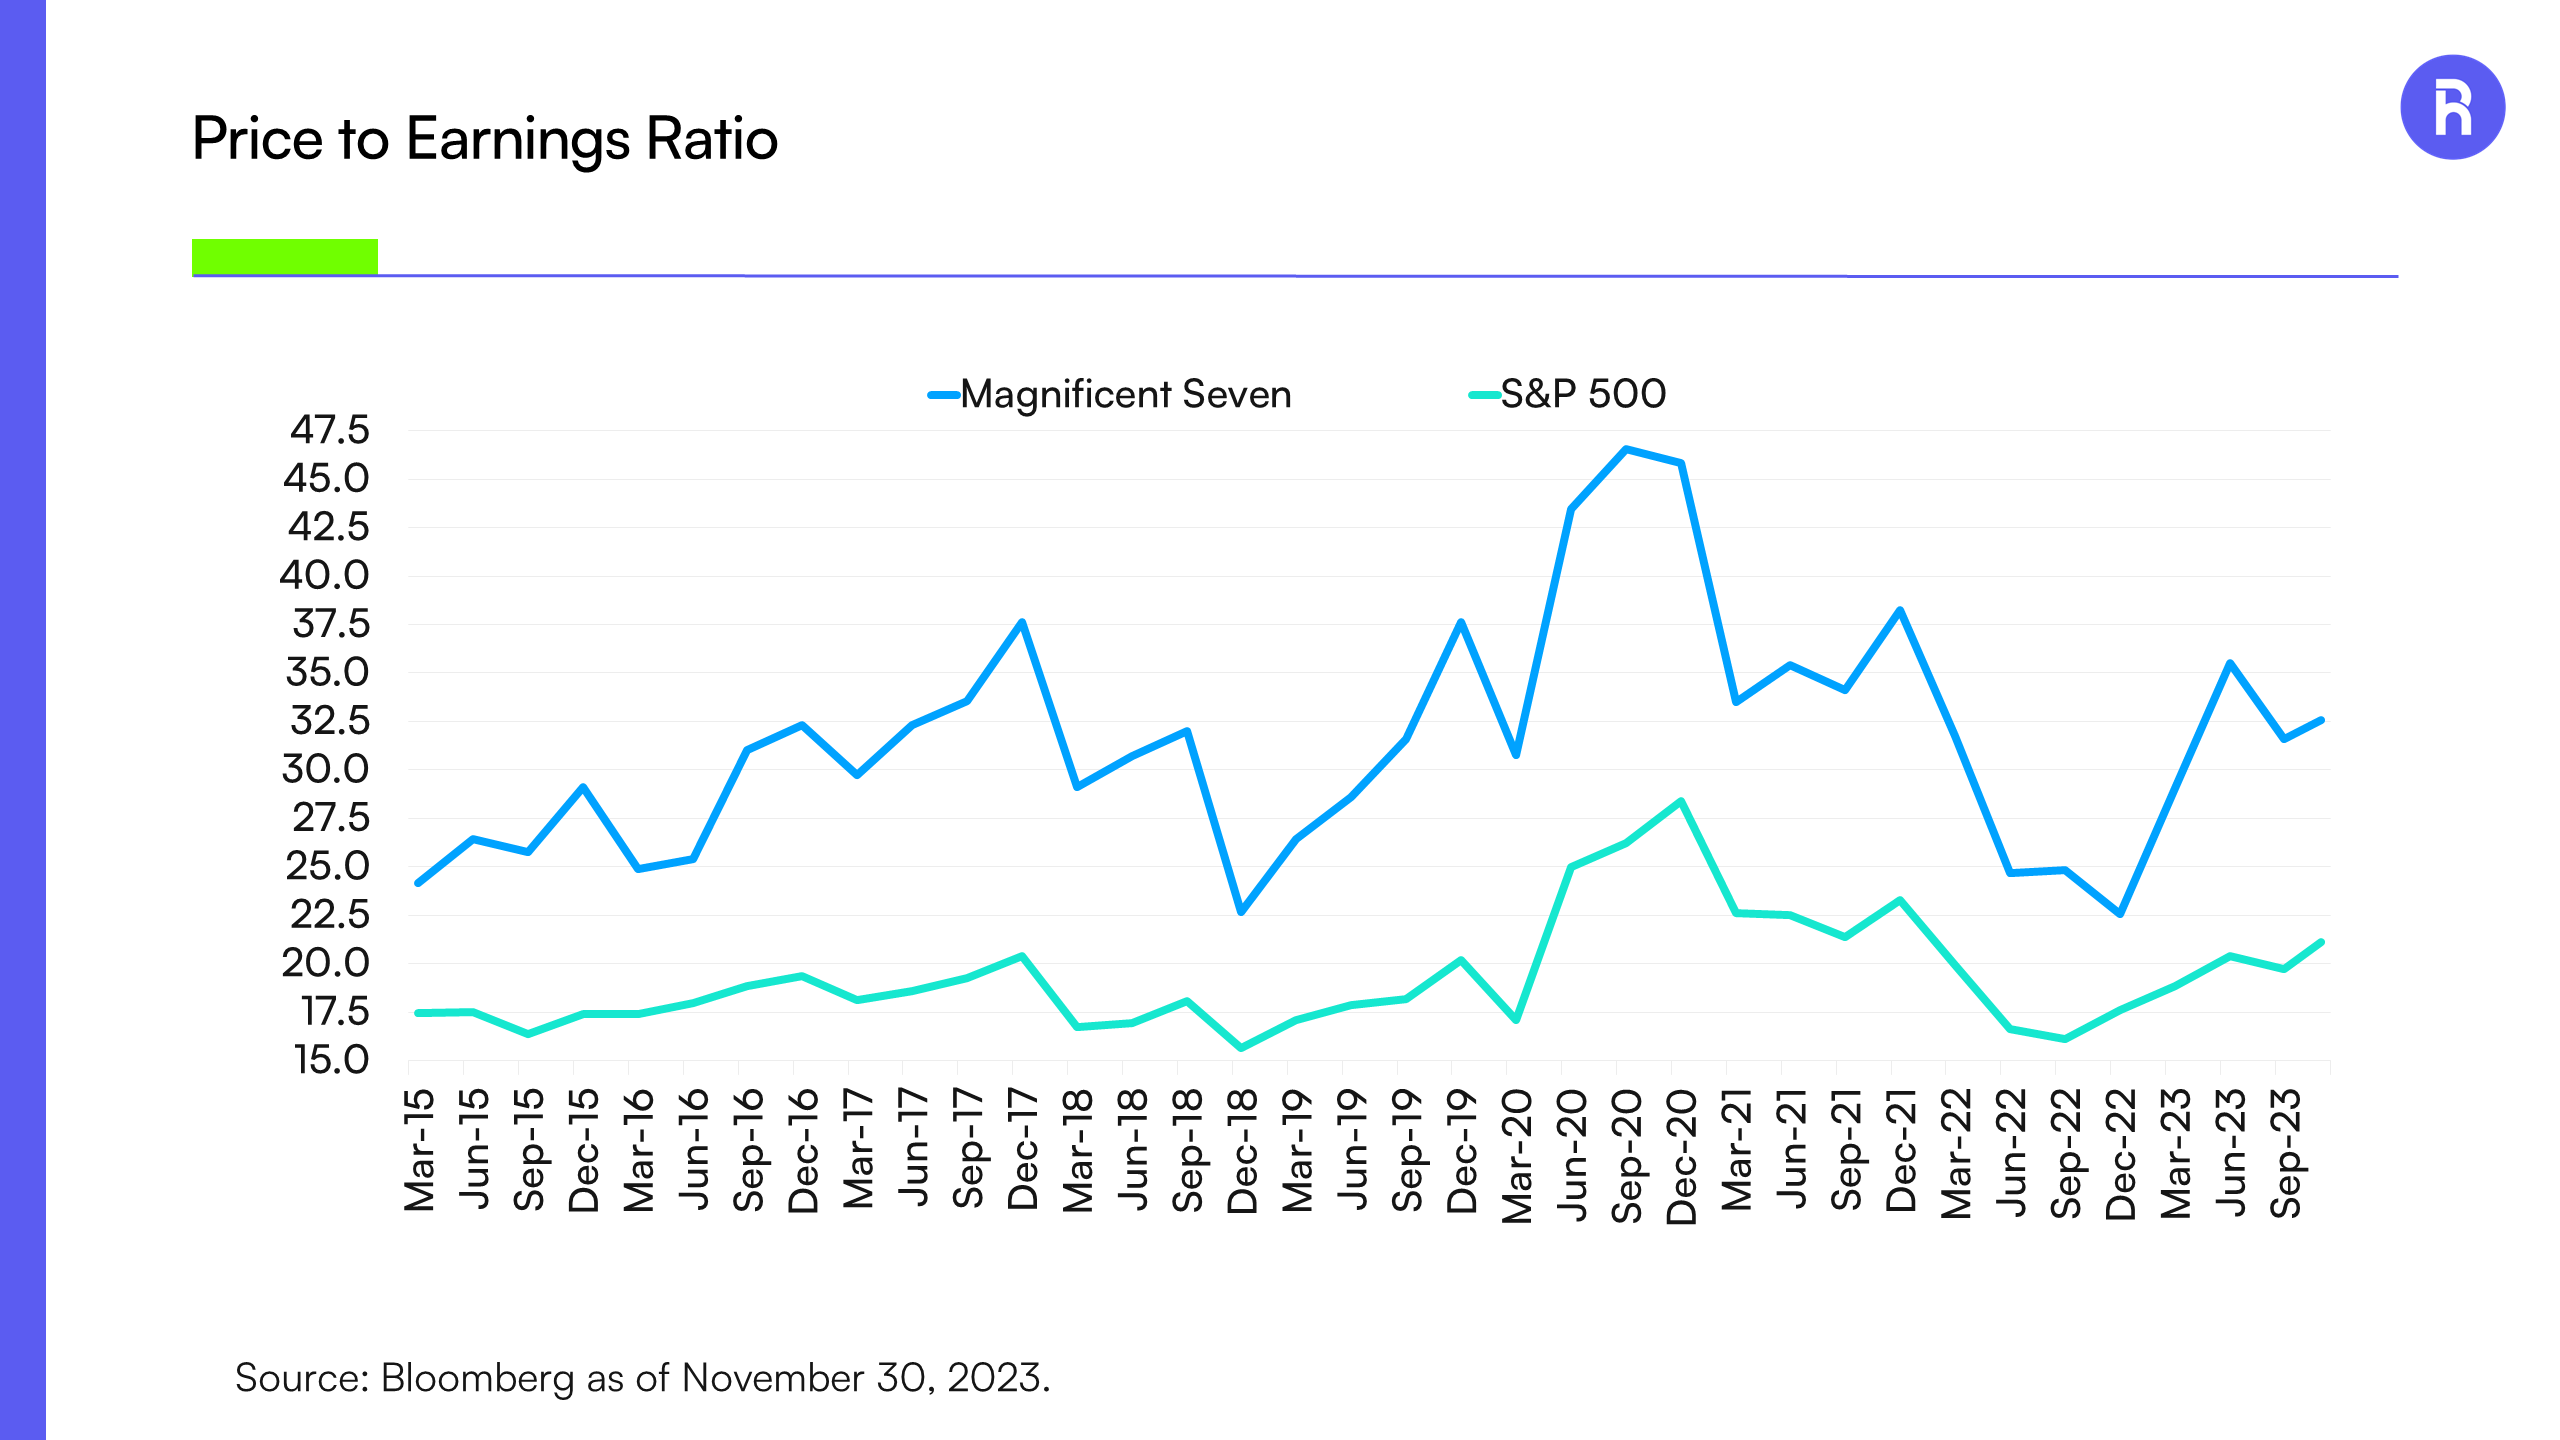
The outsized performance of the Magnificent Seven has stirred a frenzy among some investors who have become increasingly concerned about the lack of breadth driving 2023’s market rally. Adding to the skepticism, naysayers are highlighting valuations, noting that the Magnificent Seven trade at 32 times forward price-to-earnings, compared to the S&P 500's 21 times. However, while 32x is indeed more richly valued than 21x, it's important to note that, relative to their own historical valuations, the S&P 500 is currently more expensive than the Magnificent Seven.
Magnificent Seven Trade at a Higher Multiple than the Broader Market
Source: Bloomberg, as of November 30, 2023.
So, the Magnificent Seven stocks are more expensive than the broader market, but that is not exactly news. They have been for years.
However, what might be overlooked is the rationale behind the impressive performance of these stocks and the potential for this trend to persist.
Let’s dive into why that may be the case and absent a change in the market environment this could continue.
Price/Earnings to Growth Ratio
The Price/Earnings-to-Growth (PEG) Ratio is a stock’s P/E ratio divided by the growth rate of its earnings per share. It’s used to determine an investment’s valuation while also factoring in expected earnings growth. While not as commonly used as the simple P/E, the PEG can provide a more complete picture than the P/E ratio alone.
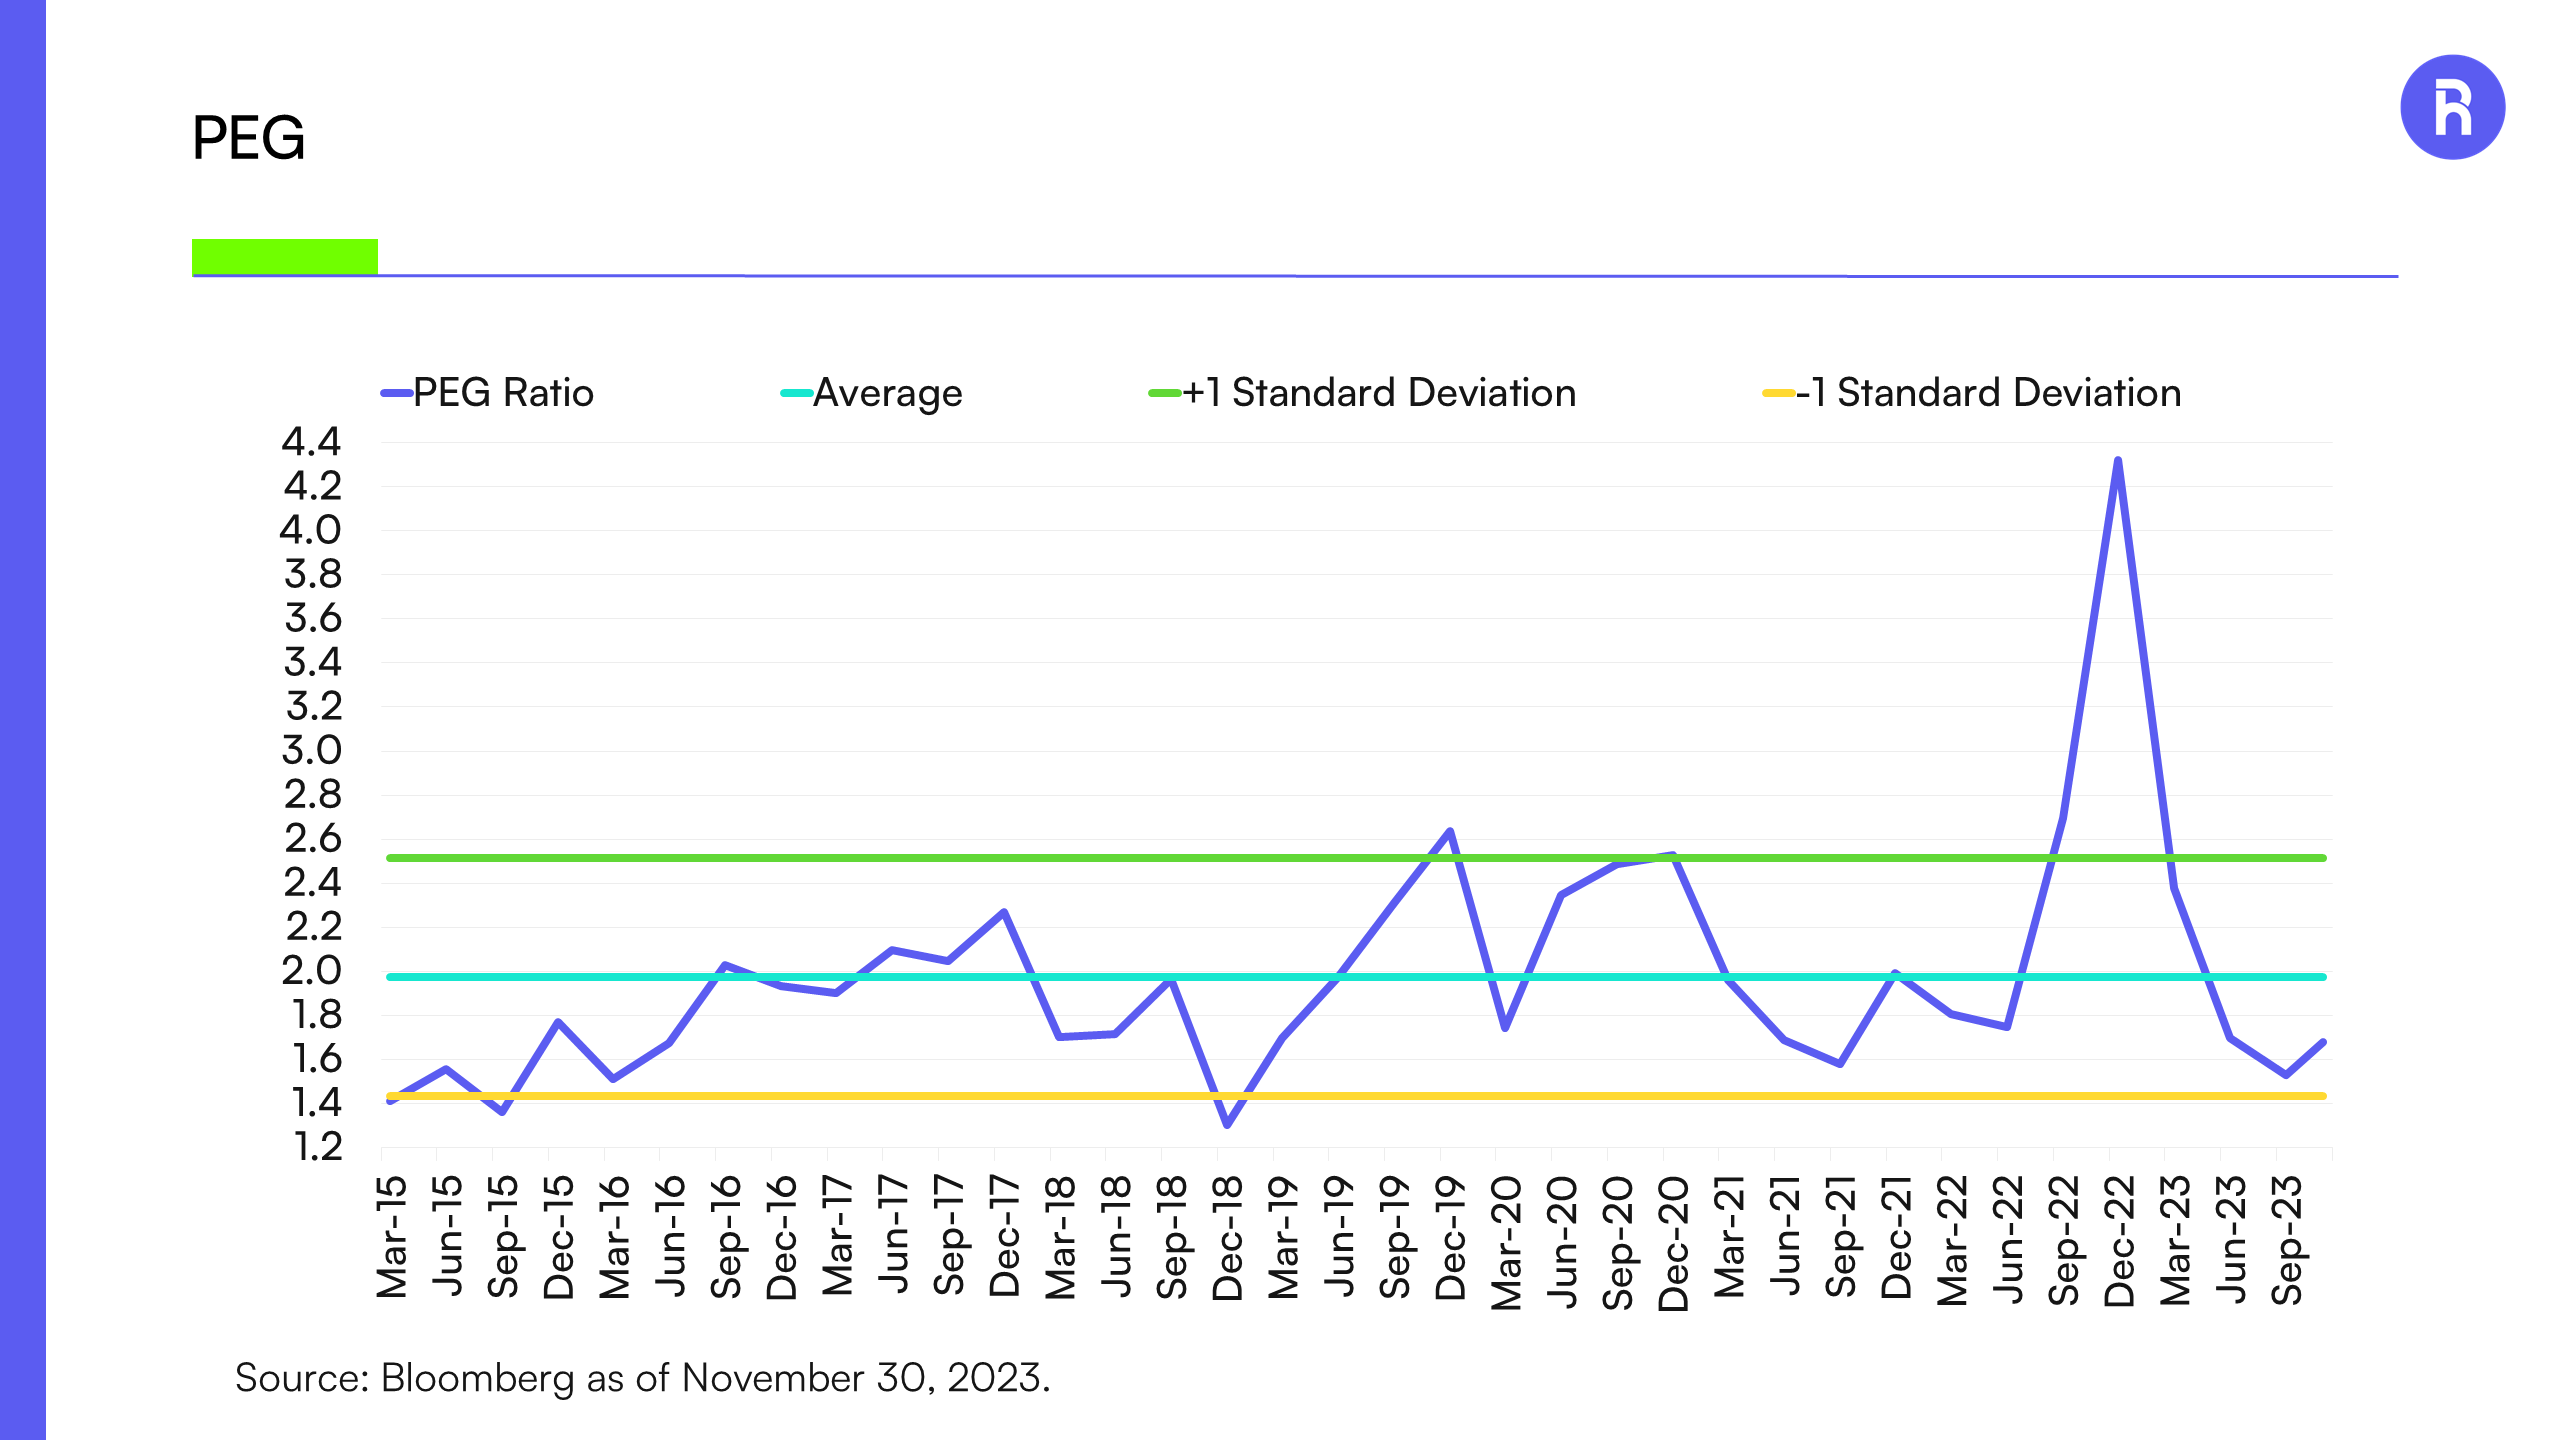
Notably, the Magnificent Seven’s PEG ratio spiked at the end of 2022, reaching 4.32, which is well above the group’s +1 standard deviation marker of 2.51. This suggests that the Magnificent Seven stocks were likely overvalued compared to their history, and that their earnings growth did not justify the high P/E ratio at that time.
Conversely, in the third quarter of 2023 the ratio fell below the average, approaching the -1 standard deviation marker as forward earnings growth for the seven companies were stronger than expected. The Magnificent Seven stock's PEG ratio is currently 1.68 and below the group's historical average of 1.97 implying that they may actually be undervalued when earnings growth is considered.
Magnificent Seven Are Not as Expensive when Growth is Considered
Source: Bloomberg, as of November 30, 2023.
Earnings
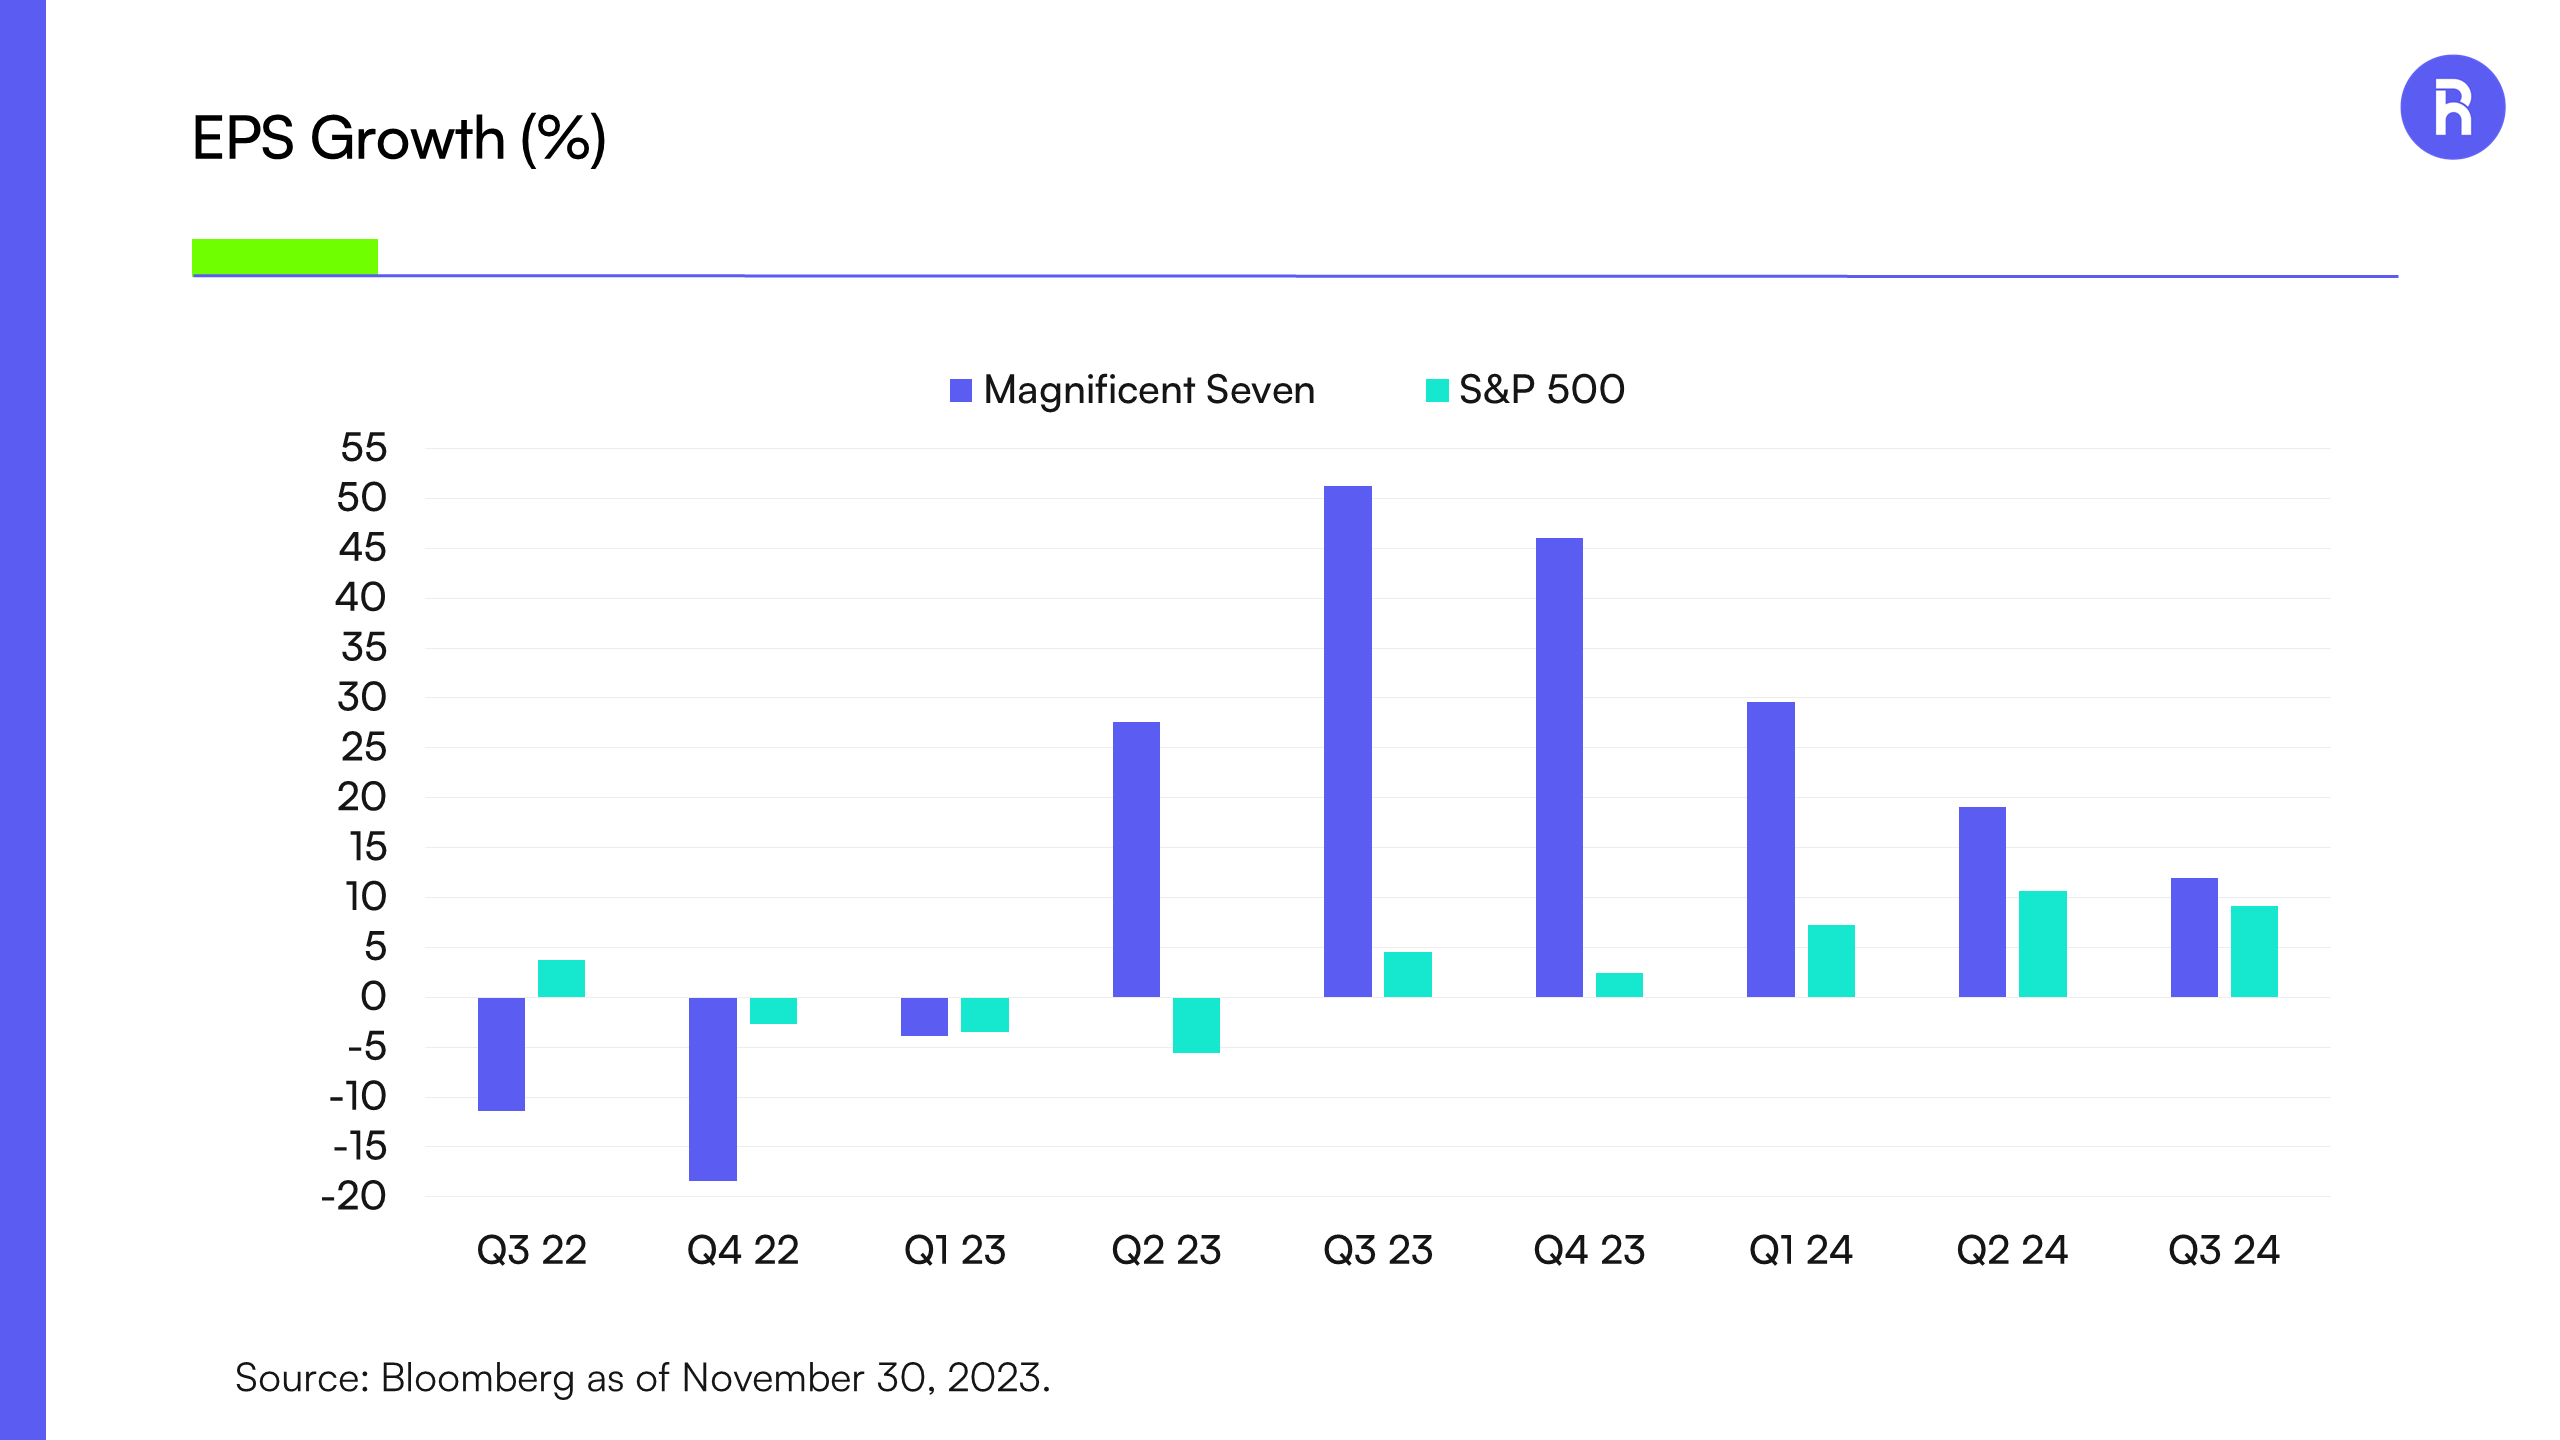
The Magnificent Seven stocks posted negative EPS growth in Q3 2022, Q4 2022, and Q1 2023. However, starting in Q2 2023, EPS experienced a significant recovery which has continued since. Meanwhile, earnings growth for the S&P 500 did not turn positive until Q3 2023 and is expected to be slower than the Magnificent Seven moving forward.
From a rate of change perspective, we acknowledge that the Magnificent Seven stocks are expected to decelerate. However, they remain considerably higher than the broader market. Notably, the earnings for the S&P 500 includes the Magnificent Seven even stocks, and excluding them would make the overall index numbers worse through the end of next year (including negative growth for Q3 2023).
Magnificent Seven Offer Superior Growth
Source: Bloomberg, as of November 30, 2023.
Operating Margins
Operating margins are a measure of profitability, illustrating the percentage of revenue that is turned into profit after accounting for variable costs of production. Investors favor companies with high operating margins as they can provide a cushion during economic downturns, allowing companies to absorb shocks and maintain profitability.
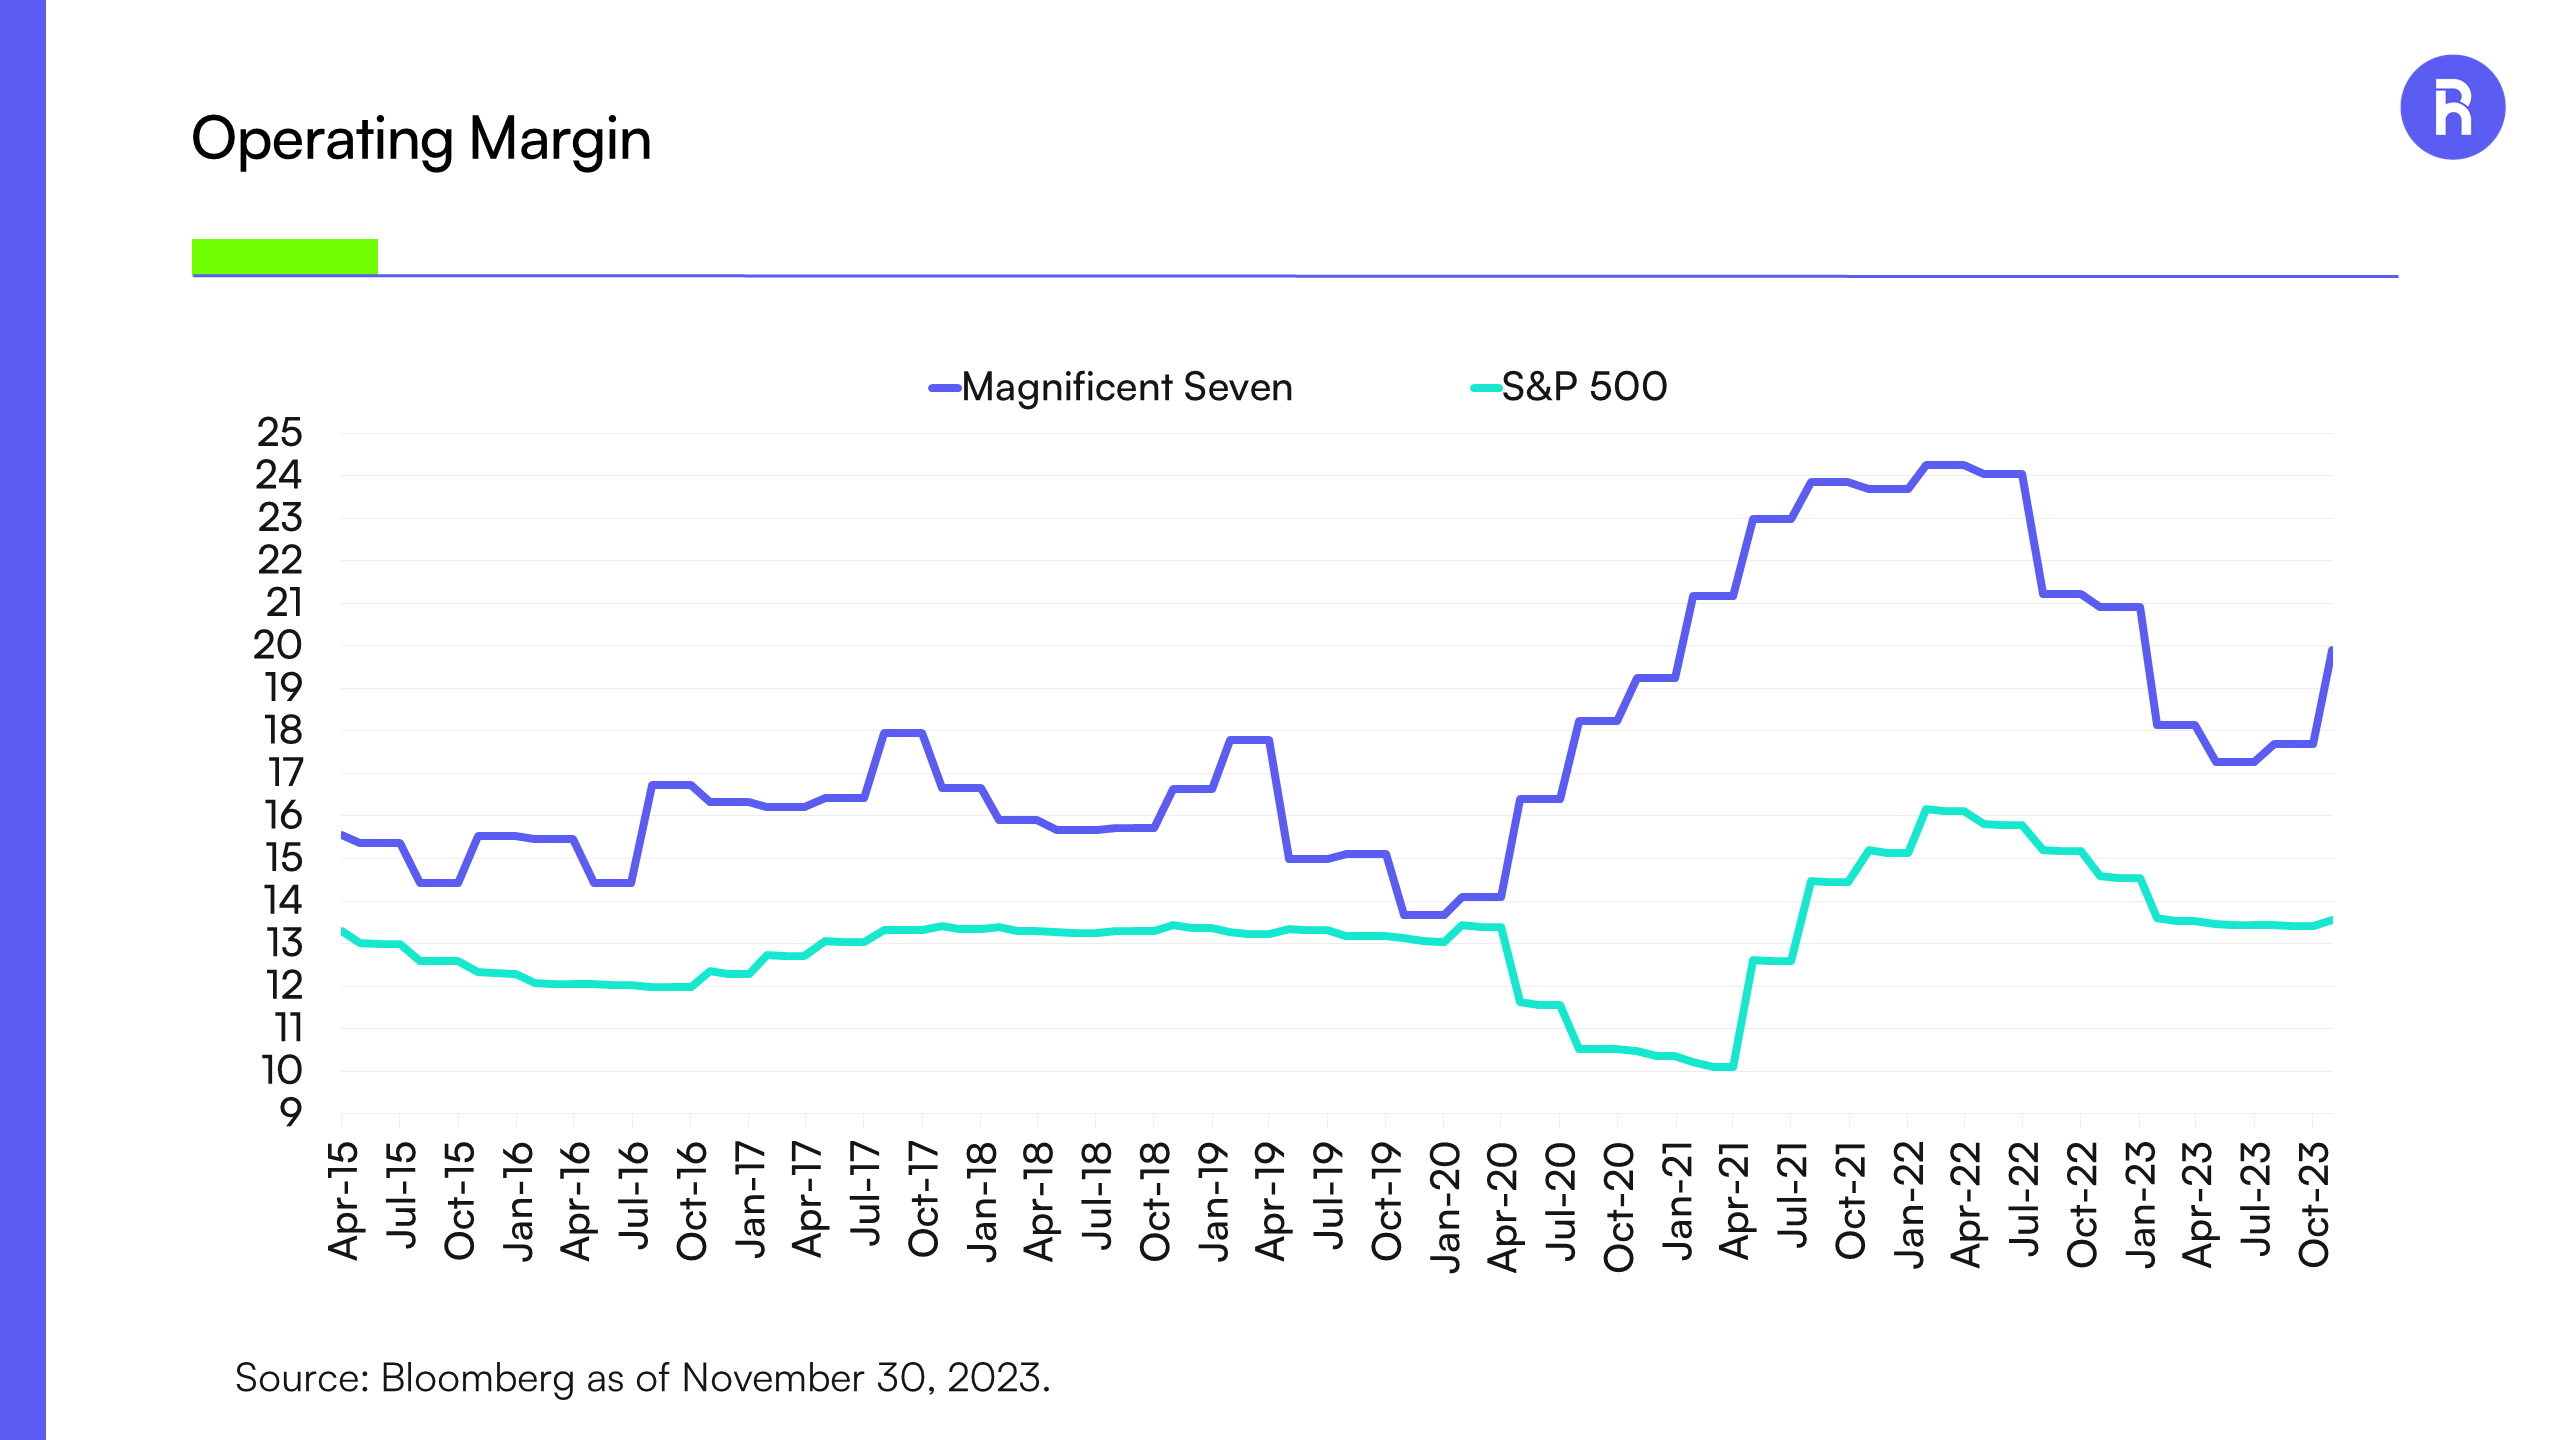
The average operating margin for the Magnificent Seven is considerably higher than the S&P 500. While there are industry-specific differences to consider, there is a marked difference as the Magnificent Seven stocks sport margins close to 19.91%, while the broader market is 13.55%.
The Magnificent Seven have demonstrated the ability to significantly increase operating margins over several years, including the pandemic, possibly indicating the benefits of a combination of cost-cutting, efficiency gains, and pricing power. At the same time, the broader market was unable to achieve the same levels of efficiency.
Magnificent Seven Sport High Operating Margins
Source: Bloomberg, as of November 30, 2023.
Implications
The Magnificent Seven may have outperformed due to their robust earnings growth and high operating margins, and also because of their resilience and adaptability in a shifting economic landscape. Their ability to capitalize on technological advancements, maintain efficiency, and demonstrate pricing power, suggests that as long as the macroeconomic environment does not materially change, their leadership may persist.
While some may have FOMO from not being long the stocks and others simply want to call a top, the same factors that propelled these stocks forward could continue to drive their outperformance in the foreseeable future even as valuations remain rich.
The performance data quoted represents past performance. Past performance does not guarantee future results. Current performance may be lower or higher than the performance data quoted. The investment return and principal value of an investment will fluctuate so that an investor's shares, when sold or redeemed, may be worth more or less than their original cost. Returns less than one year are not annualized. For the most recent month-end performance, please call (855) 561-5728. You cannot invest directly in an index. Shares are bought and sold at market price (closing price), not net asset value (NAV), and are individually redeemed from the Fund. Market performance is determined using the Primary Exchange official closing price. Brokerage commissions will reduce returns.
Carefully consider the investment objectives, risks, charges and expenses of Roundhill ETFs before investing. This and other information about each fund is contained in the Prospectus. Please read the prospectus carefully before investing as it explains the risks associated with investing in the ETFs.
These include risks related to investments in small and mid-capitalization companies, which may be more volatile and less liquid due to limited resources or product lines and more sensitive to economic factors. Funds investments may be non-diversified, meaning its assets may be concentrated in fewer individual holdings than a diversified fund and, therefore, more exposed to individual stock volatility than diversified funds. Investments in foreign securities involves social and political instability, market illiquidity, exchange-rate fluctuation, high volatility and limited regulation risks. Emerging markets involve different and greater risks, as they are smaller, less liquid and more volatile than more develop countries. Depositary Receipts involve risks similar to those associated with investments in foreign securities, but may not provide a return that corresponds precisely with that of the underlying shares. All investing involves risk, including possible loss of principal. Please see the prospectus for specific risks related to each fund.
NERD, BETZ, METV, BYTE, MEME, WEED, CHAT, BIGB, MAGS, LNGG, LUXX, and KNGS are distributed by Foreside Fund Services, LLC. DEEP is distributed by Quasar Distributors, LLC.


