Key Takeaways
- We don’t think this bull market is over, but it’s aging and less forgiving. Nothing is cheap, growth expectations are high, and rising yields leave little room for error. This suggests we might be in a more volatile phase of this bull market that’s well into its fourth year.
- That puts earnings revisions front and center. Analysts keep raising S&P 500 earnings per share (EPS) estimates, and no area has seen bigger upgrades than US Large Cap Growth and the AI winners within it. Our core/core+ ideas lean into that trend and can be funded from areas with weaker revisions, like Large Cap Value and Small/Mid Cap.
- For a volatile quarter, we offer up two satellite ideas. Photonics to buy sentiment-driven artificial intelligence (AI) pullbacks, where growth prospects haven’t changed despite the selloff. HALO stocks as a diversifier to the AI trade with less exposure to rising rates and a more attractive fundamental setup than traditional low volatility stocks.
Market Outlook: An Aging Bull
We don’t think this bull market is over. But older bull markets share some features: nothing is really cheap, growth expectations are high, and volatility rises. Add today’s interest rate backdrop, and earnings really have to deliver. That’s why this quarter’s Focus Five leans into growth trades where Wall Street has been raising earnings estimates and a non-traditional defensive idea with less rate sensitivity and better valuation versus growth balance.
We’ll start with what we think is the most misleading datapoint from chart fanatics: the S&P 500’s falling forward price-to-earnings ratio (P/E, index price relative to expected earnings). This suggests an easier valuation setup. Mechanically, that’s right. Forward P/E is falling because earnings expectations are rising faster than prices. But that gives a false sense of security.
We prefer to ask what’s priced in? So we solve for the long-term growth rate that justifies today’s S&P 500 level. That growth rate is high versus history, which fits a bull market now into its fourth year. So there’s no easy setup for stocks, and we think it isn’t getting easier.
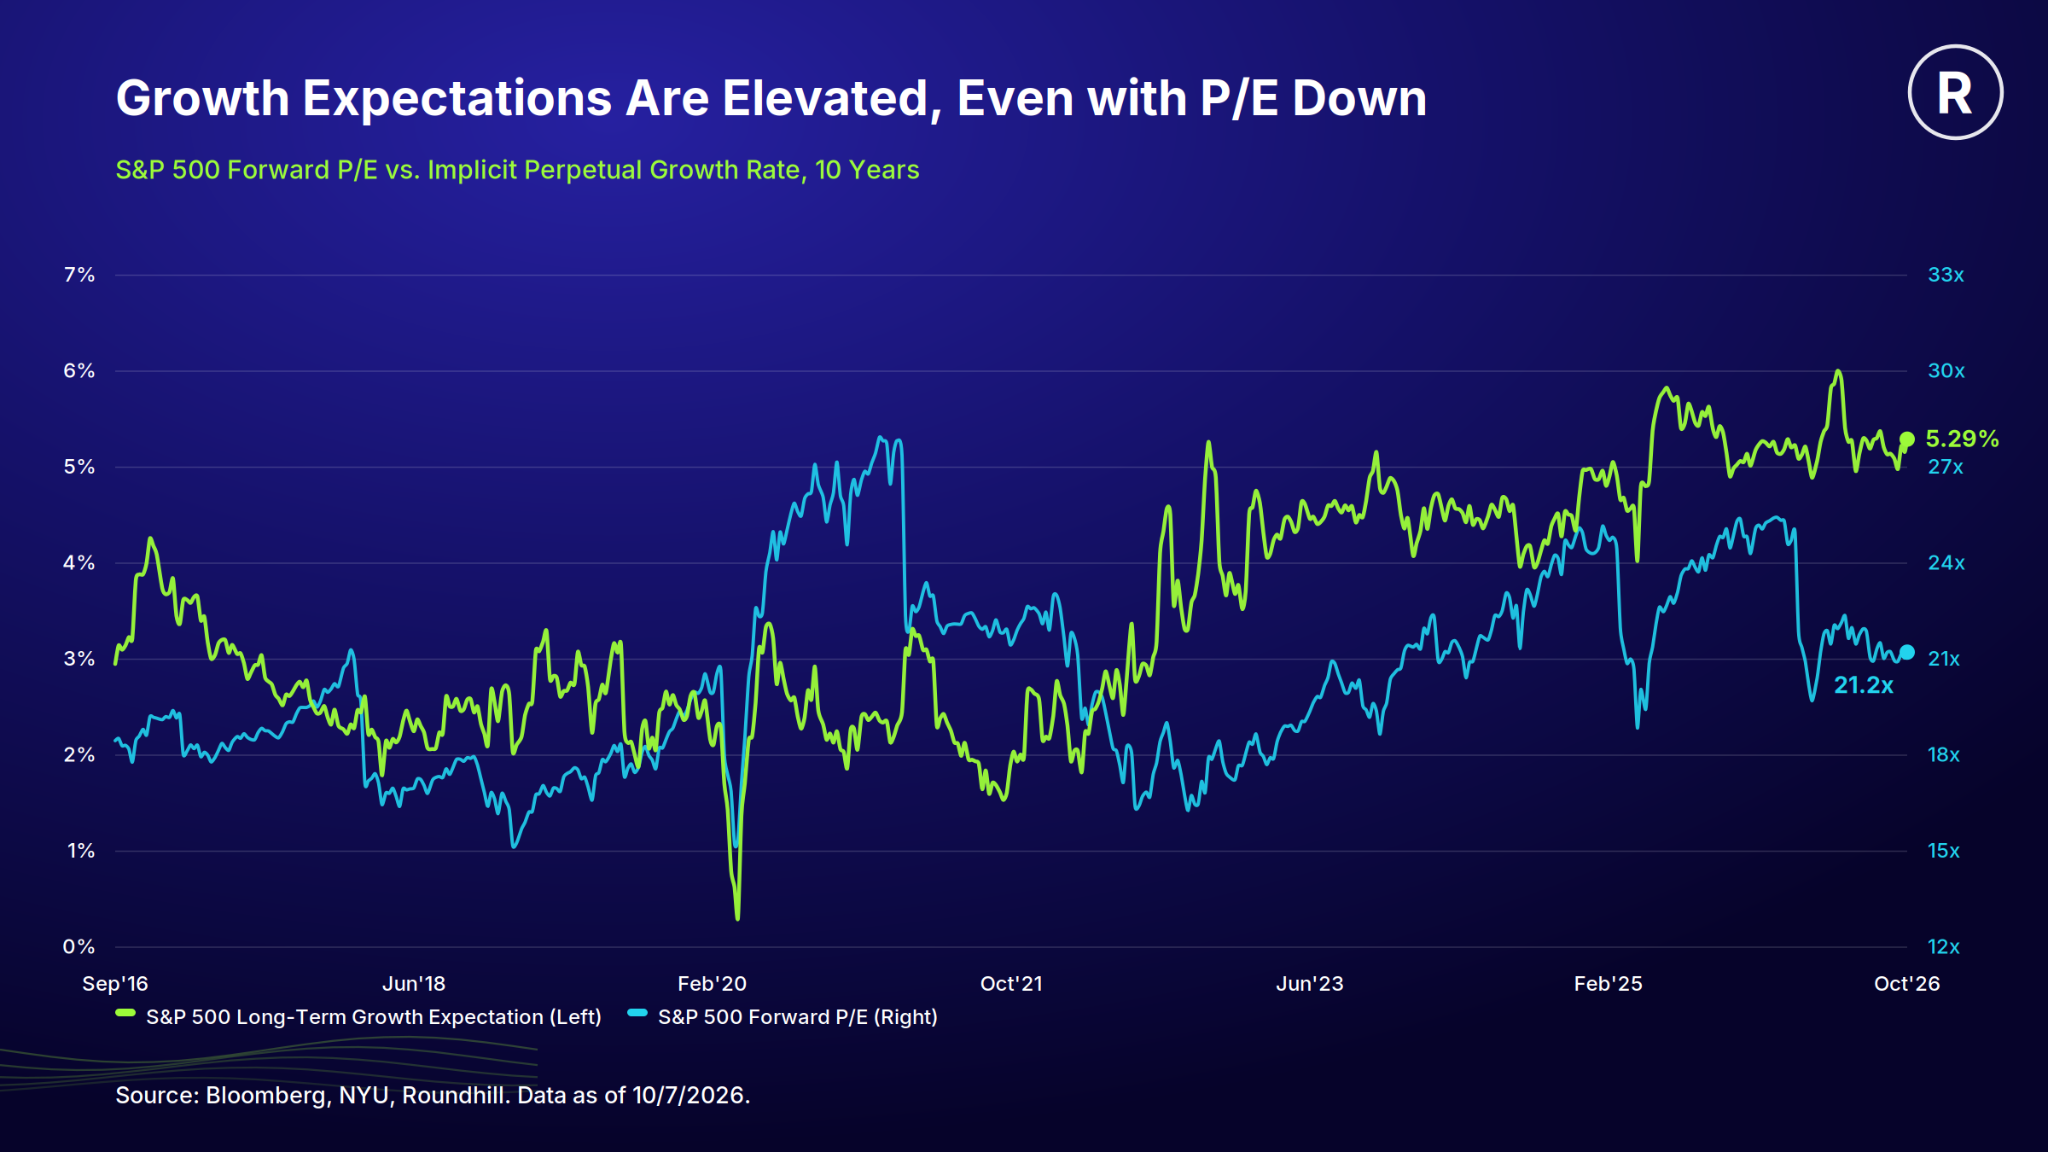
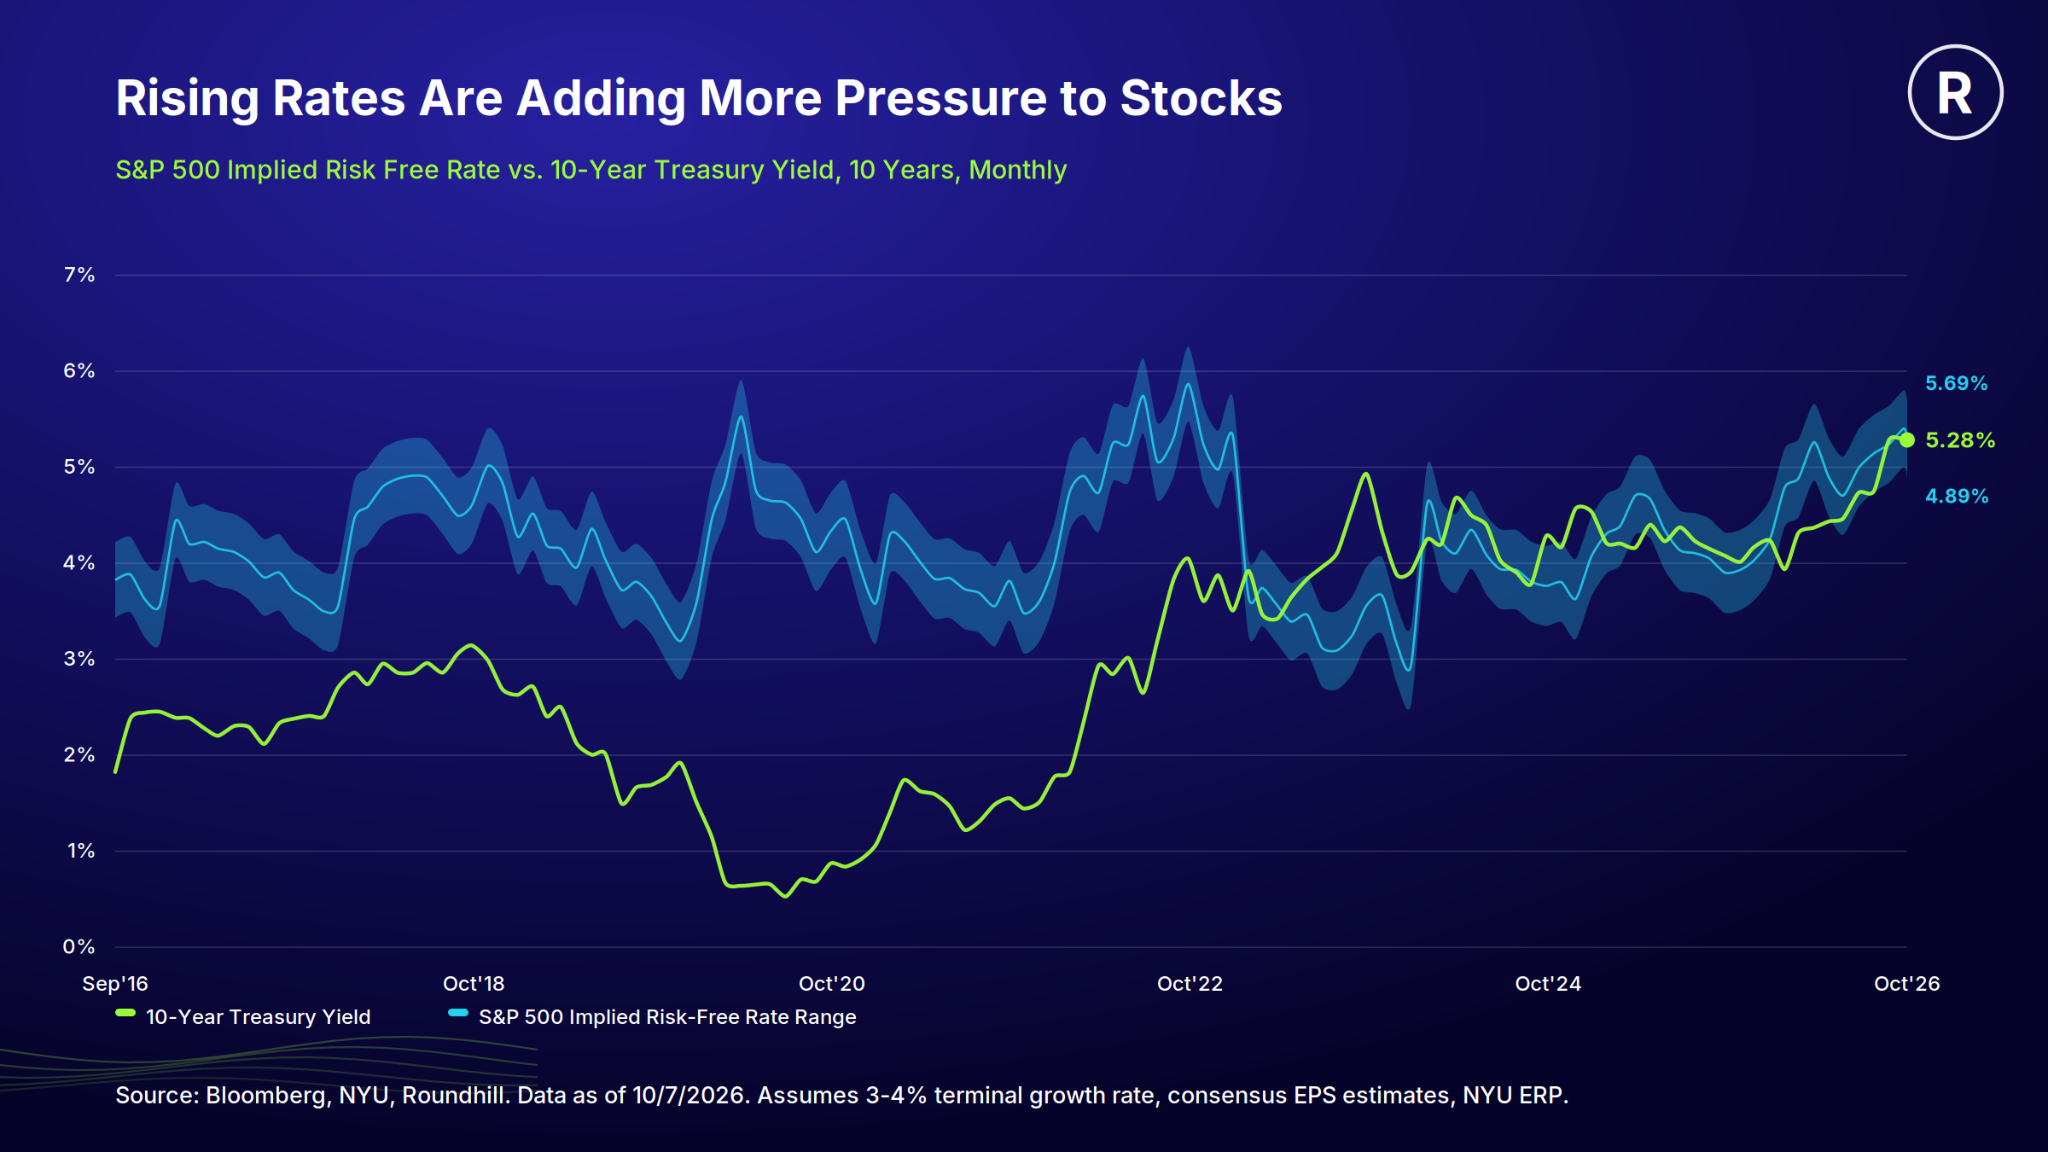
Rates add pressure on top of that. To us, rising yields are the biggest threat to stocks. Higher Treasury yields raise borrowing costs for businesses and consumers, and they make bonds more competitive with stocks. After the latest moves in rates, our modelling suggests the S&P 500 can’t handle much more.
Together, high growth expectations and little room for higher rates puts pressure on earnings to deliver. So far, they have. Looking ahead, the direction of estimates matters most, which has us focused on analyst consensus S&P 500 earnings per share (EPS) projections. The chart below shows the consensus expectations for S&P 500 earnings for every year from 2026 through 2029. The big message to us is that they keep getting revised higher. To us, it’s the most important chart in markets right now, and we expect it to stay in focus into year-end.
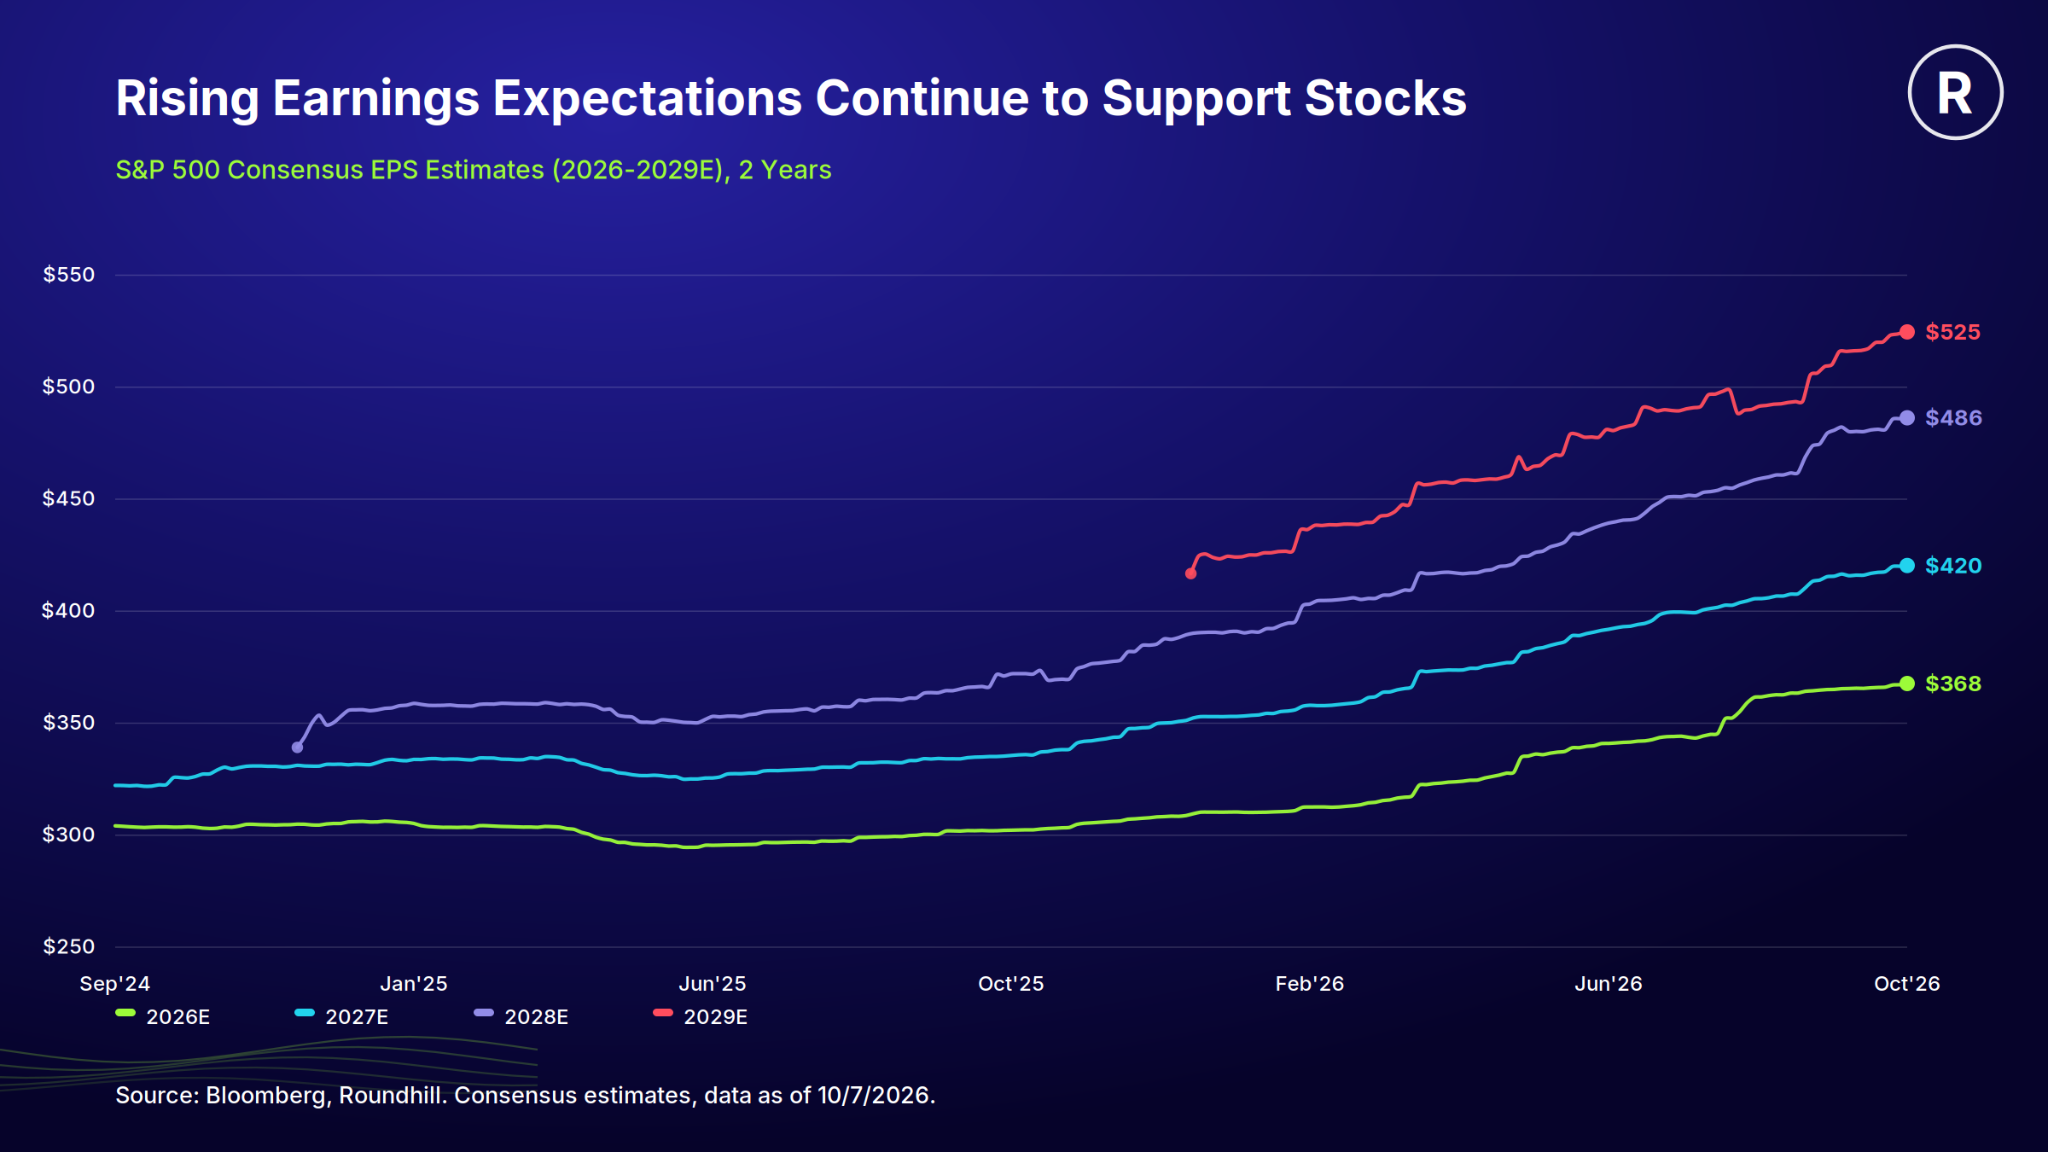
Ultimately, we think the bull market can push higher despite a tougher macro backdrop and high expectations, but it takes conviction in longer-term growth trajectories. It’ll have to work through volatility, as we’ve seen lately.
Tilt Your Core to Large Cap Growth
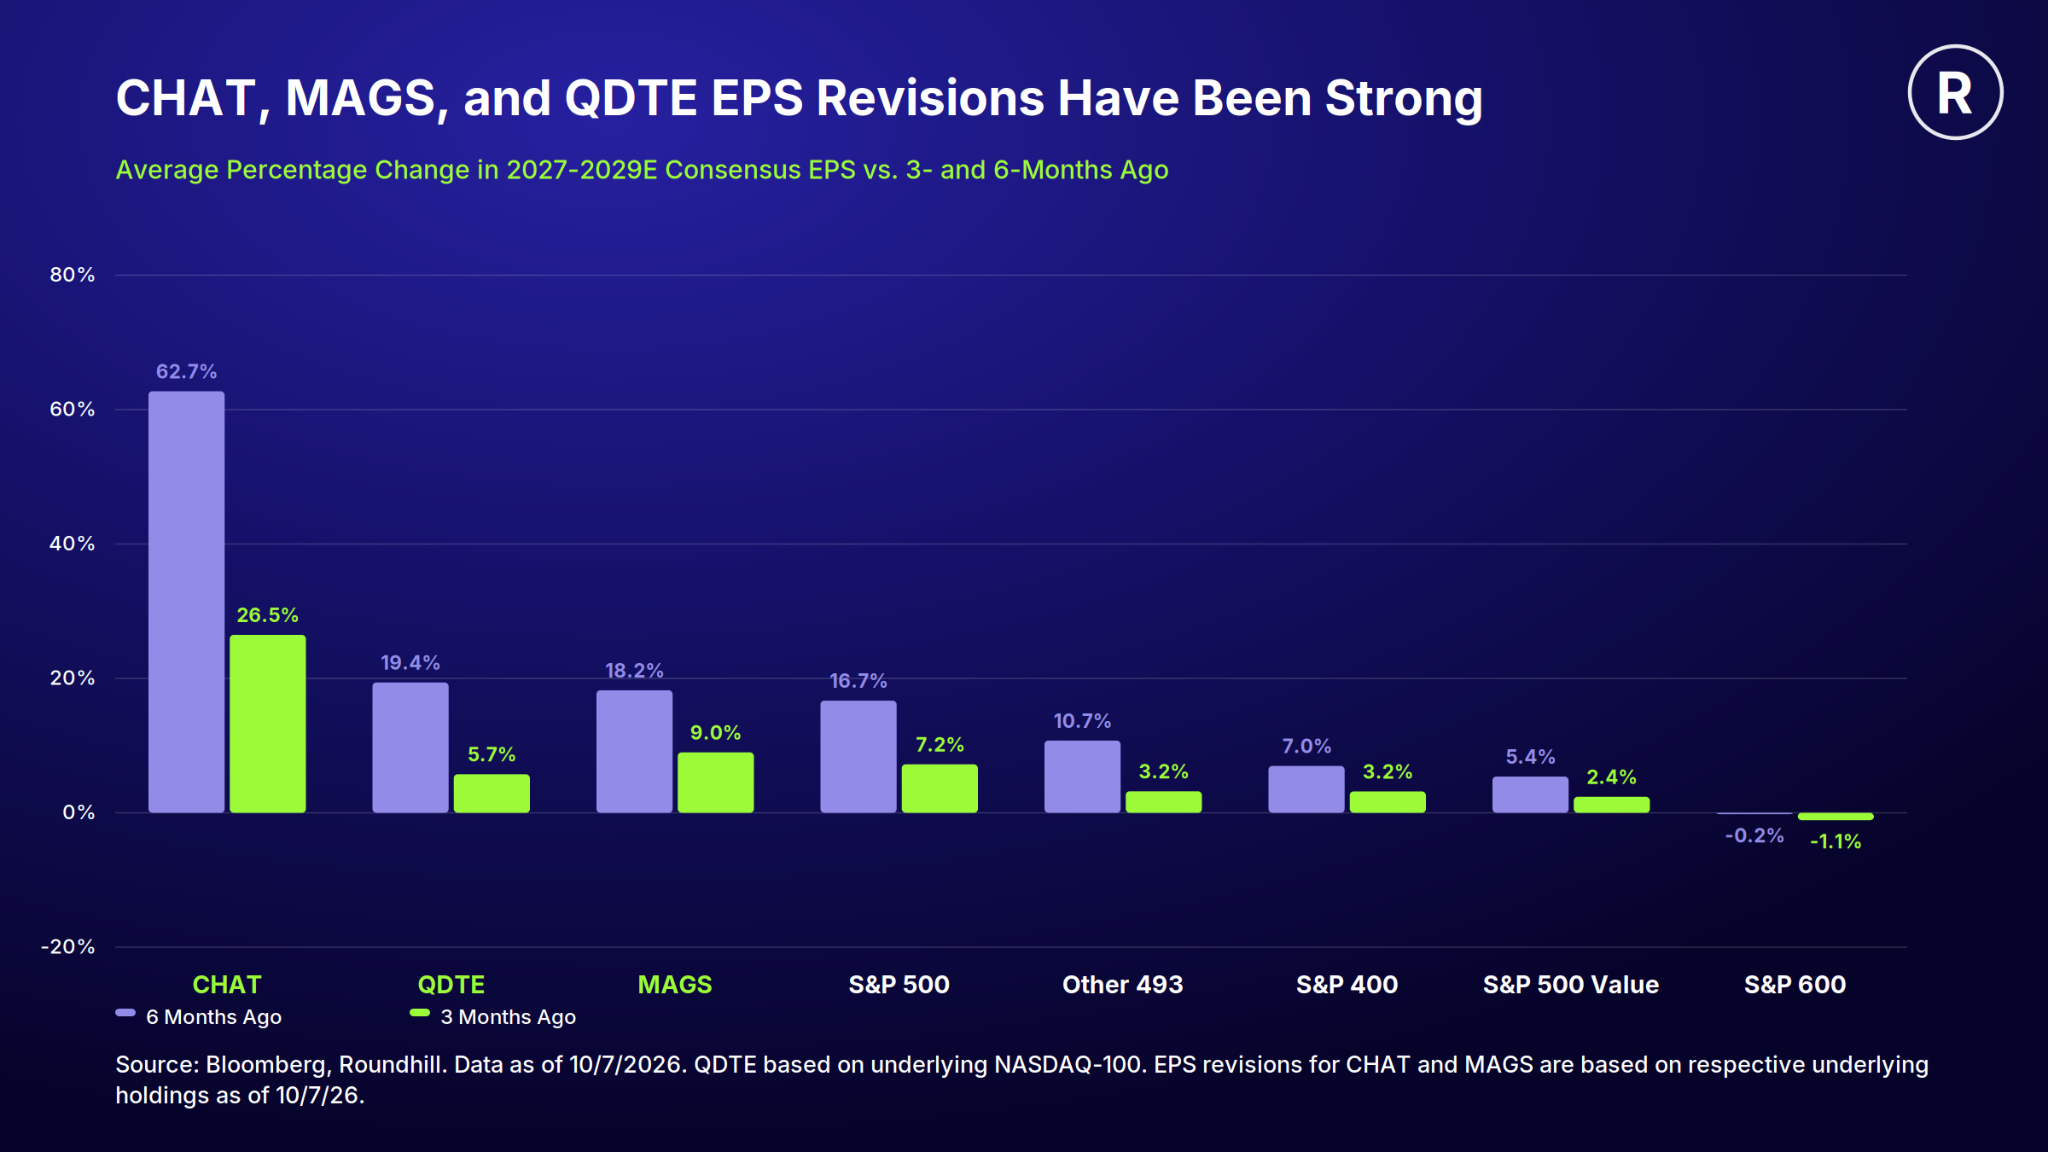
- CHAT, MAGS, and QDTE have stronger earnings revisions than the broader market
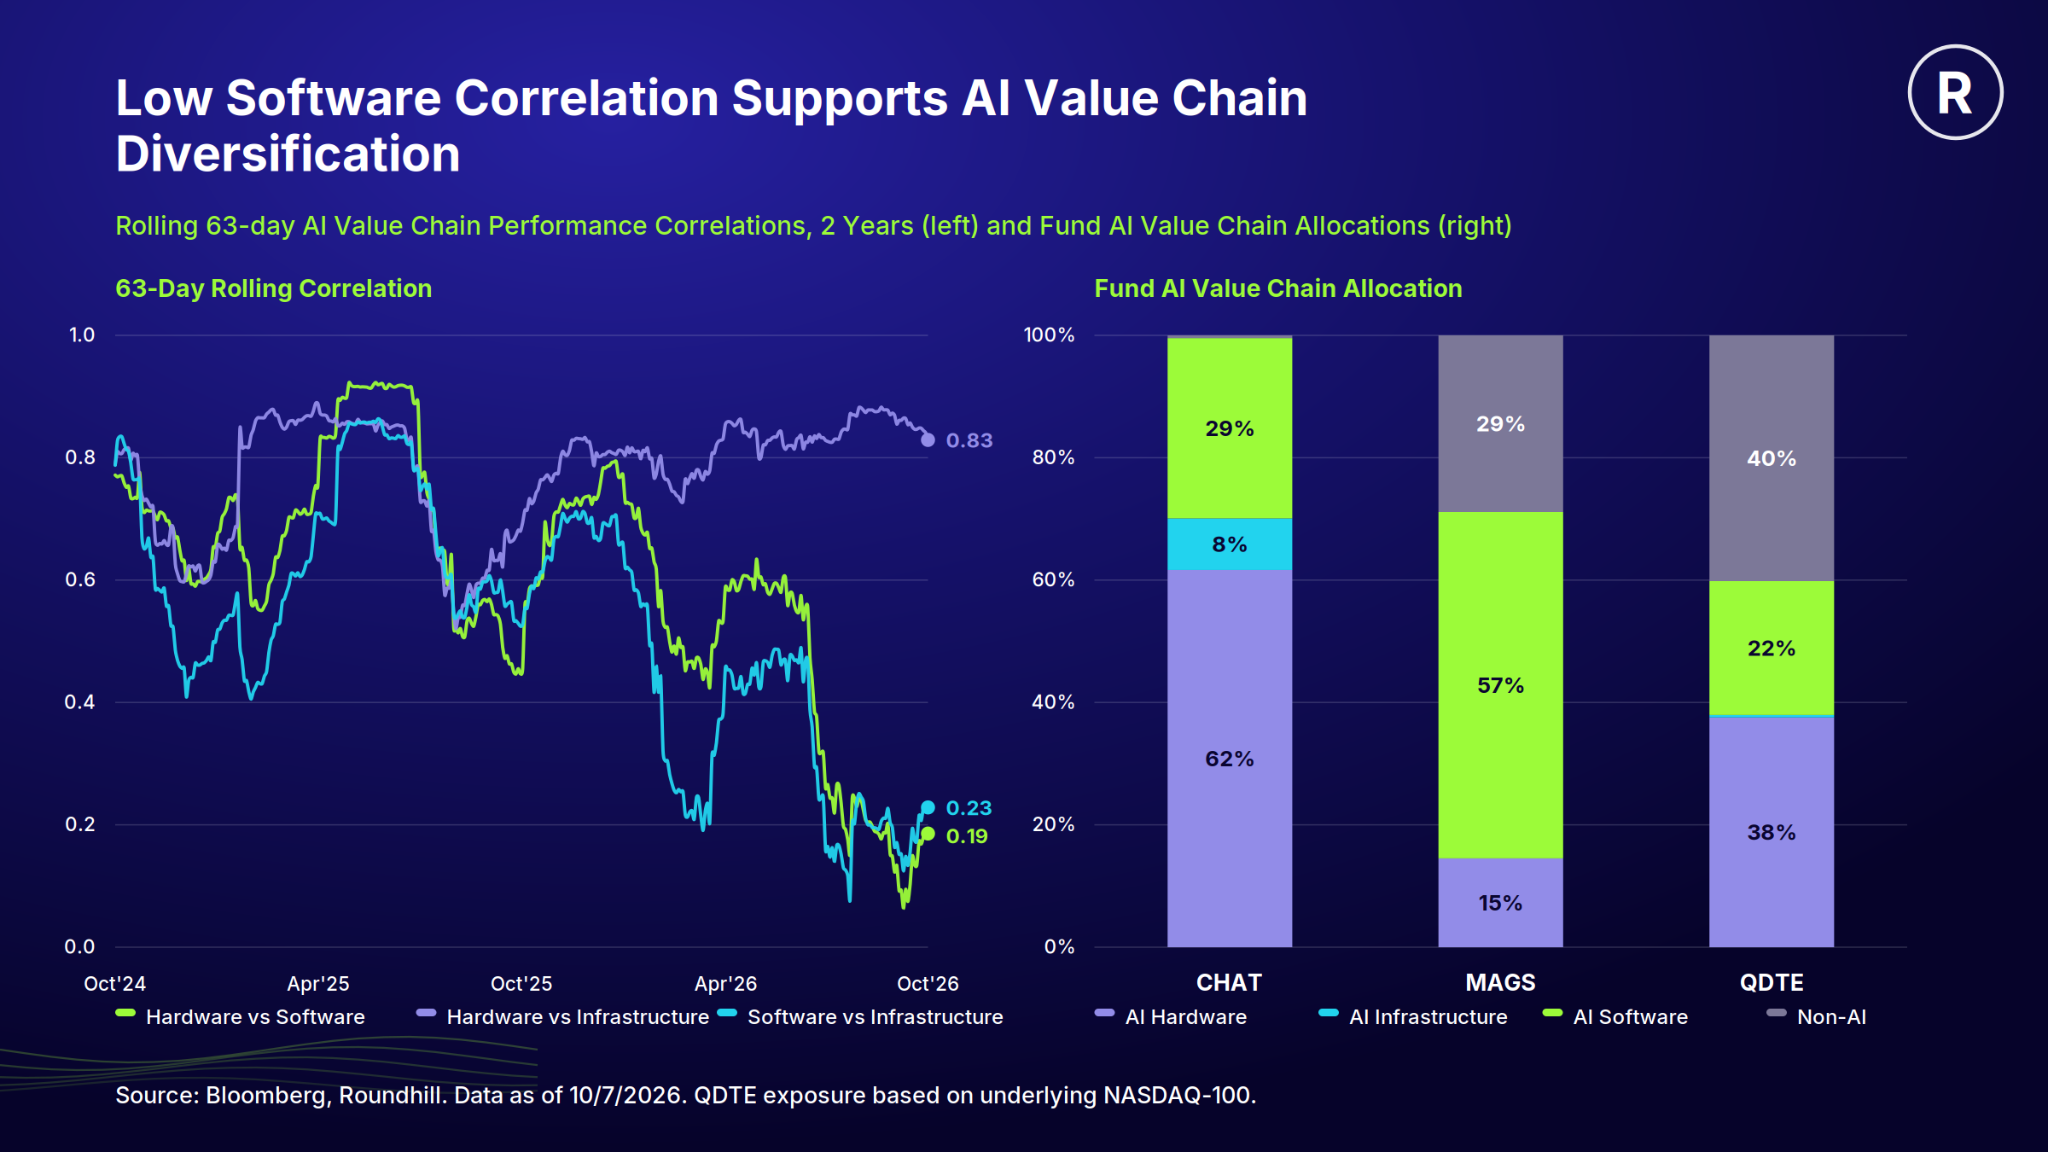
- They offer AI value chain diversification, which could help manage AI headline risk
- Consider funding these from revision laggards like Large Cap Value and Small/Mid Cap
No area has seen better upward revisions than US Large Cap Growth and the long-term AI winners. We believe the Roundhill Generative AI & Technology ETF (CHAT), Roundhill Magnificent Seven ETF (MAGS), and Roundhill NASDAQ-100 0DTE Covered Call Strategy ETF (QDTE) fit that narrative well (Fund investment strategies can be found in the disclosure section). CHAT, MAGS, and QDTE’s underlying index have all seen larger revisions than the broader S&P 500, and the gap is wider versus the Other 493 (the Bloomberg 500 ex-Magnificent Seven), Mid Cap (S&P 400), Large Cap Value (S&P 500 Value), and Small Cap (S&P 600).
To be fair, AI sentiment swings could be a headwind. Anthropic CEO Dario Amodei’s essay, We Must Pace the Frontier, grabbed attention, as did reports of AI model breaches. Still, new launches like Meta Platforms’ Muse and Alphabet’s latest Gemini upgrade support the trend toward wider AI adoption and demand.
In our view, the key to managing the theme’s volatility is exposure across the AI value chain. AI software has been an important diversifier given its low correlation to other AI categories. CHAT, MAGS, and QDTE all hold exposure across the chain, with different tilts to hardware or software.
For implementation, investors could add to these core/core+ ETFs (funds suitable for larger allocations in a broader portfolio) from cash on pullbacks, or rotate from areas with lagging revisions like Large Cap Value, Mid Cap. or Small Cap. In short, we like underweighting the revision laggards into year-end. On QDTE, our 0DTE options overwriting strategy, it could replace for lower beta options income ETFs on pullbacks, since the strategy tends to better follow underlying index moves.
Playing for AI Rebounds
- Global photonics and optics stocks have borne the brunt of investor selling post-essay
- We believe these companies can be added on pullbacks at the expense of traditional Tech
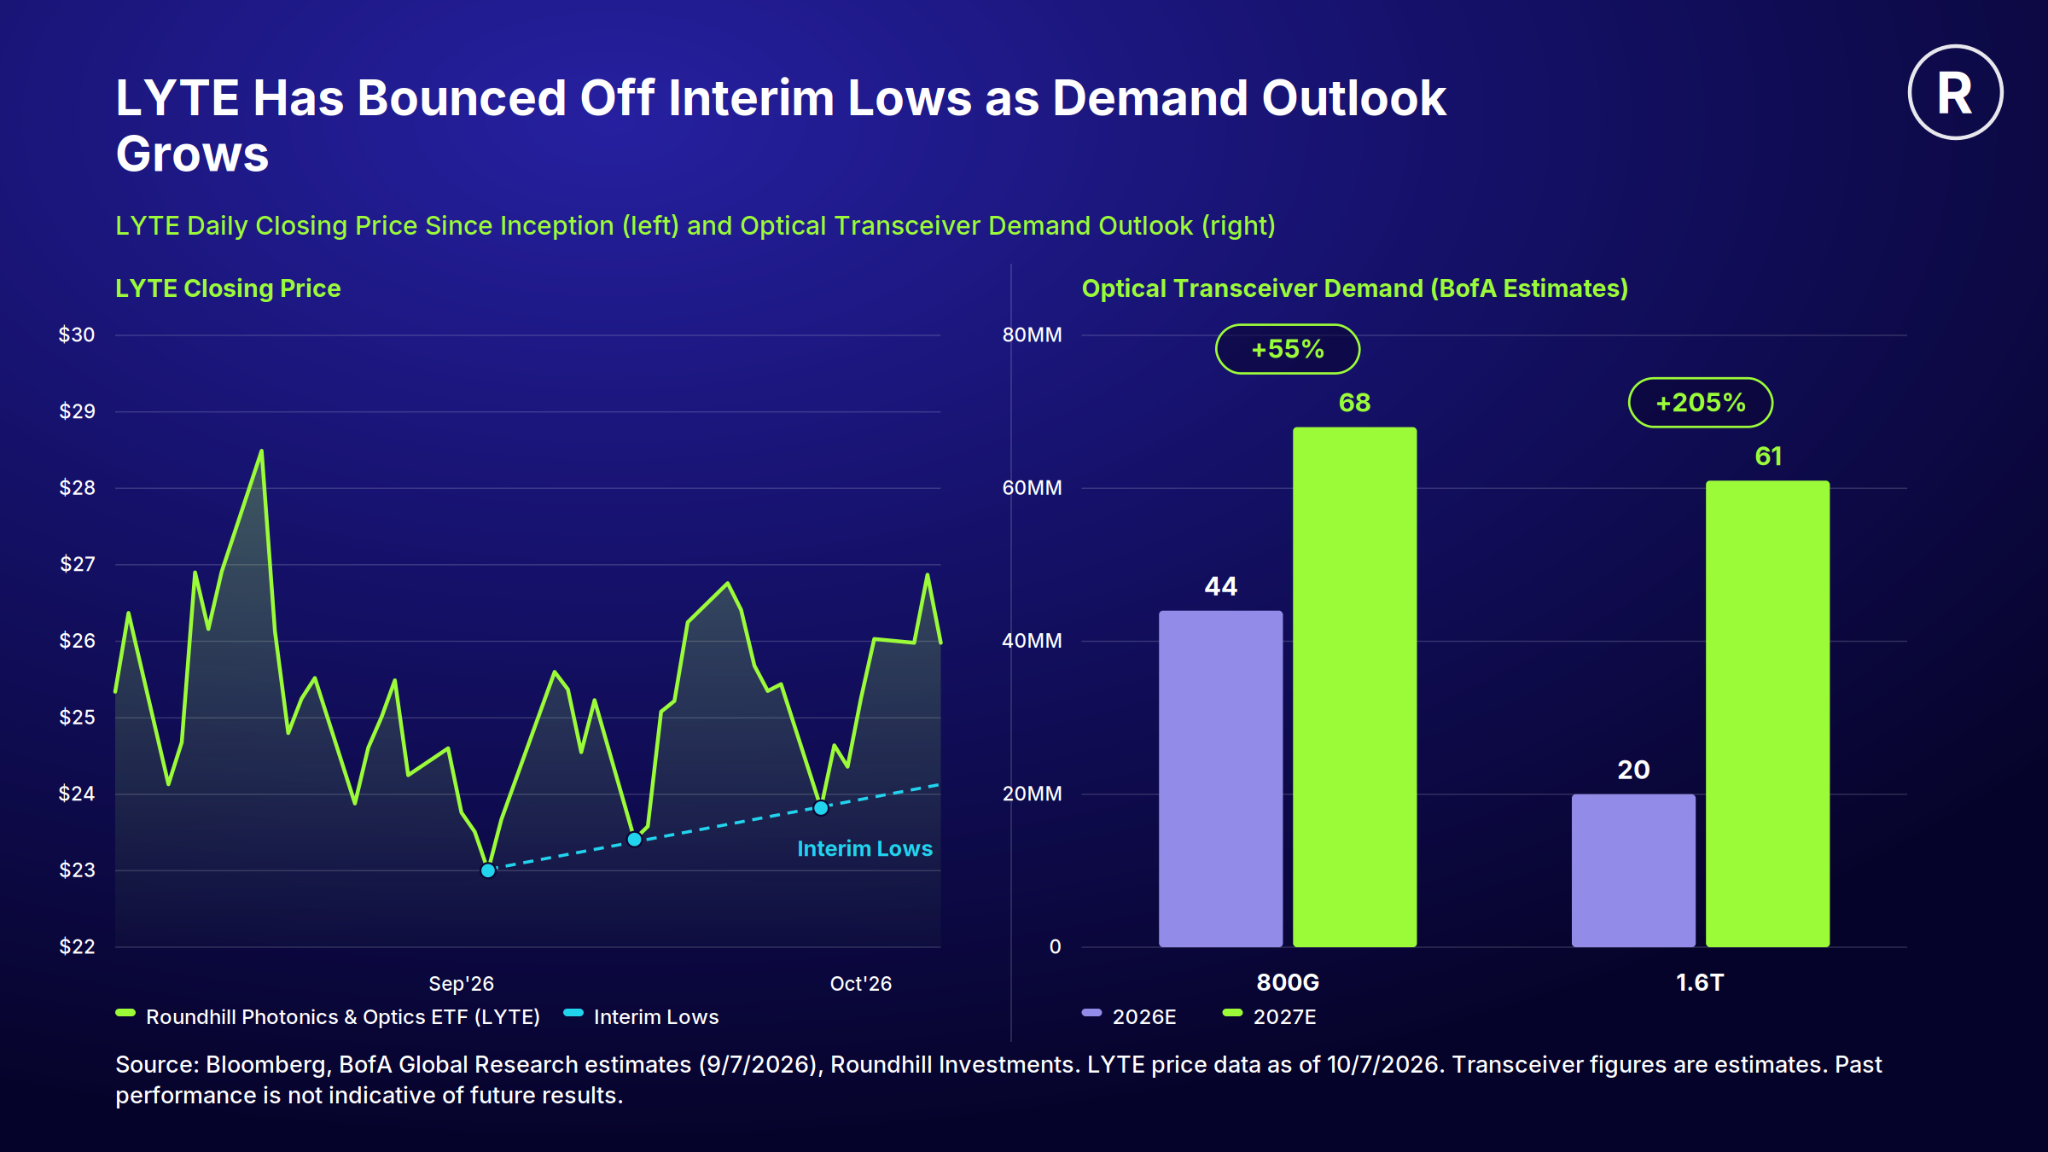
- Our work suggests growth prospects put a floor in photonics and optics stocks
We believe the Roundhill Photonics & Optics ETF (LYTE) can serve as a high-beta satellite allocation, meaning a smaller, differentiated position alongside broader funds, to add on pullbacks instead of traditional tech sector or industry group exposure. Photonics and optics stocks have seen sentiment-driven volatility without a change in their growth prospects. Bank of America analysts expect the shift to 800-gigabit and 1.6-terabit modules (the optical components that move data around AI data centers) to double unit shipments in 2027 versus 2026 with 1.6-terabit shipments alone potentially tripling. We see this is an underappreciated catalyst that could reinforce LYTE as an AI thematic leader during rebounds over the coming months.
Differentiated Defense, With Less Rate Sensitivity
- LOHA fits as a diversifier from AI-related core/core+ positions given its low correlation
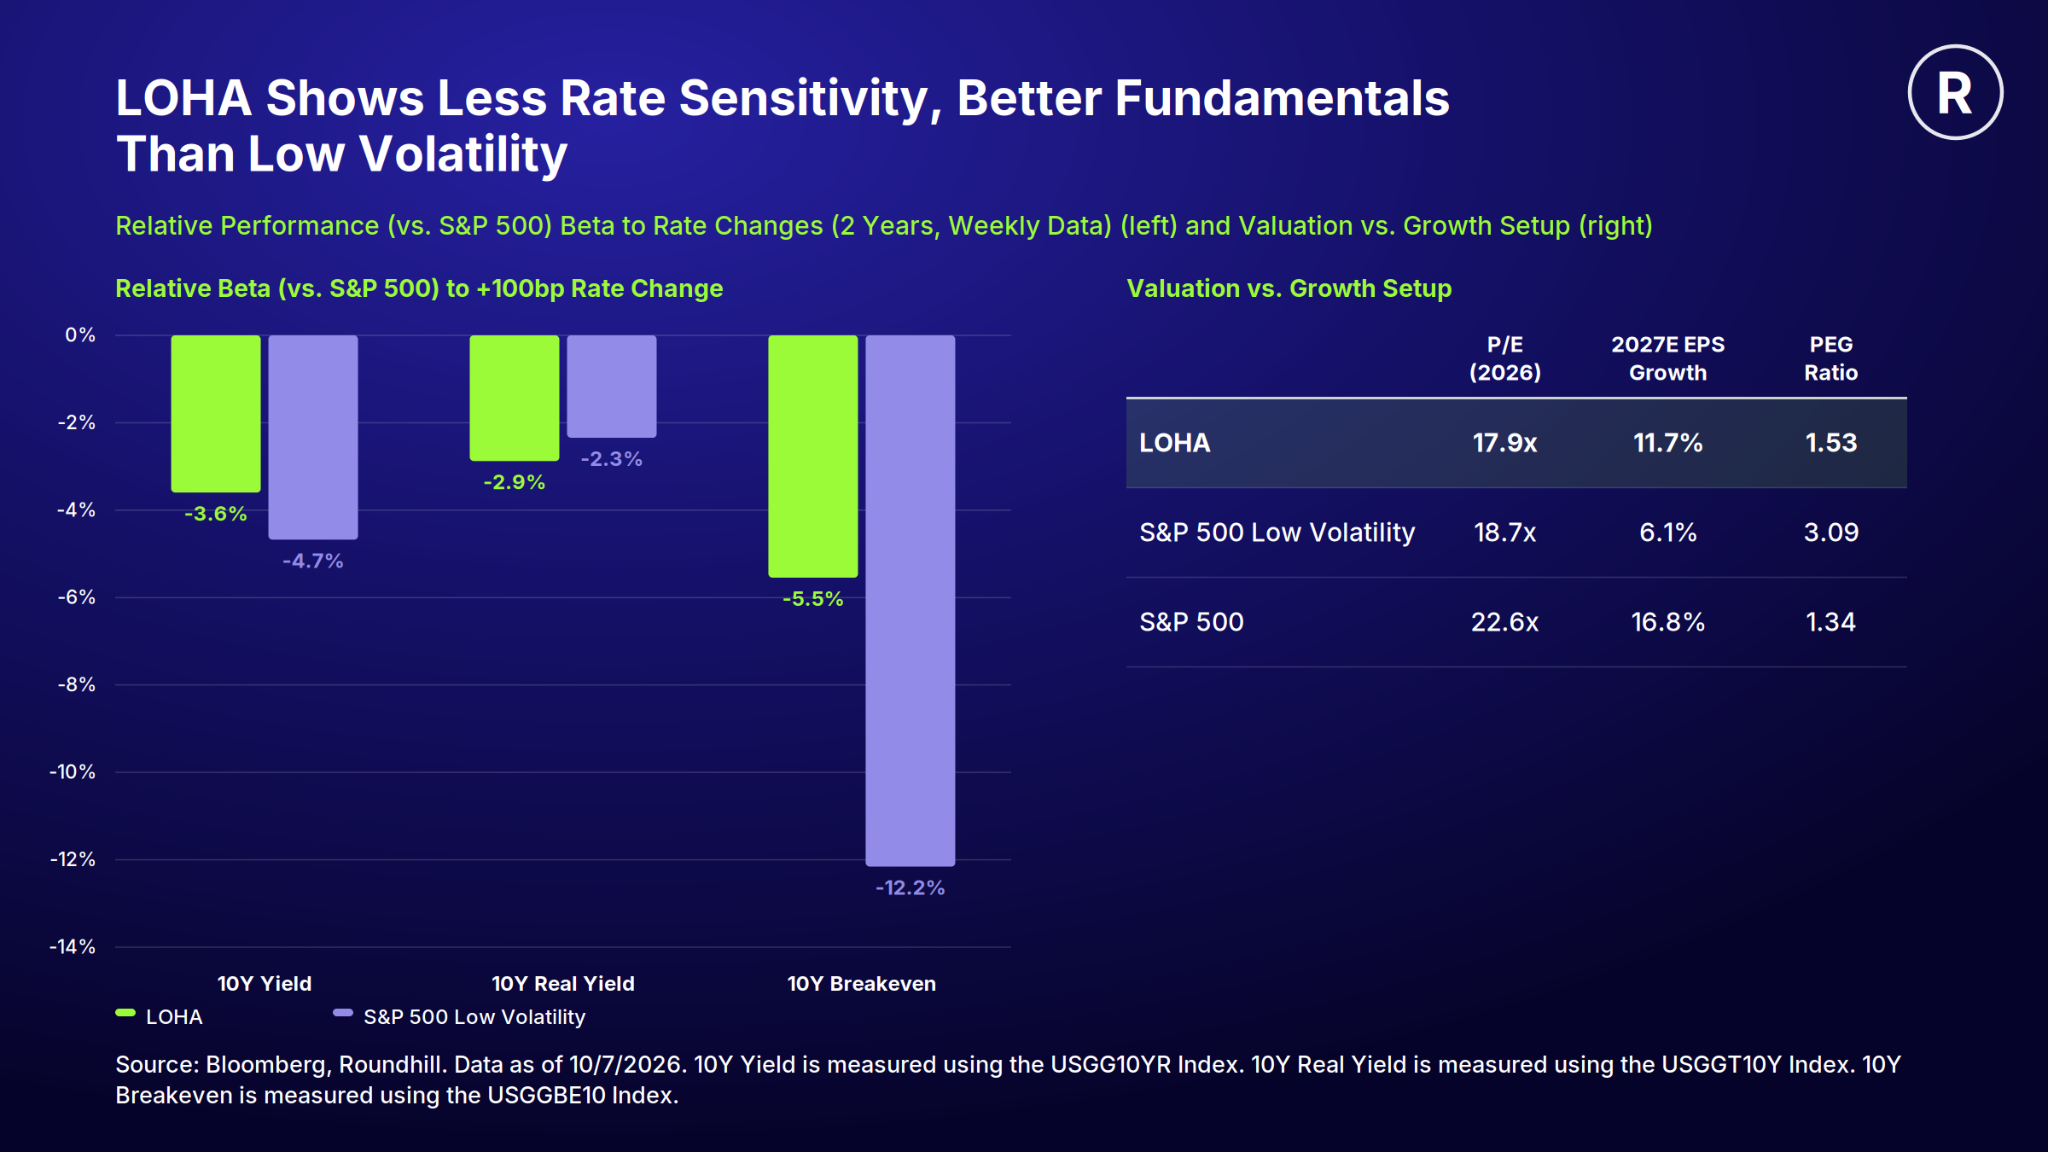
- It should fare better than traditional defensives if rates rise, based on historical sensitivities
- Fundamentally, LOHA looks more attractive on a lower valuation and higher growth outlook
We believe the Roundhill HALO ETF (LOHA) is an attractive differentiator to the core/core+ AI and growth trades we highlighted above. We believe the chart below helps make this case. Since launch, LOHA’s average correlation (a measure of how closely two assets move together) to these ETFs has been 0.23 (using the underlying exposure in QDTE’s case), versus -0.36 for low volatility stocks over that same period. This suggests both can diversify, but low volatility stocks have been more likely to offset gains. Not something we find particularly attractive when we think the bull market still has legs. The fundamentals also favor LOHA. It trades at a lower P/E than low volatility stocks but is expected to grow earnings faster next year. That translates to a PEG ratio (P/E divided by expected growth, or what investors pay per point of growth) that we believe looks more attractive too. To us, that makes LOHA a more compelling diversifying satellite than traditional low volatility factor or sector funds.
To wrap up our inaugural Focus Five, we still think we’re in a bull market, but a more volatile phase. Earnings growth and revisions remain strong, which helps offset fears of high expectations and macro headwinds like rising rates and higher oil prices. For core/core+ positioning, we favor a growth tilt via CHAT, MAGS, or QDTE. To lean in on AI pullbacks, we like smaller satellite allocations to narrow AI areas like LYTE, where the long-term growth story is intact. For diversification, rather than offsetting gains with low volatility, we’d tilt to satellites like LOHA for less rate sensitivity and a better balance of valuation and growth.
Glossary
Price-to-Earnings Ratio (P/E): The price-to-earnings (P/E) ratio compares a company's share price with its earnings per share (EPS). Analysts and investors use this to determine the relative value of a company's shares in side-by-side comparisons.
Price/Earnings-To-Growth Ratio (PEG): The price/earnings-to-growth (PEG) ratio is a valuation metric that adjusts traditional earnings multiples by factoring in a company's expected growth rate.
Earnings per share (EPS): Earnings per share (EPS) measures a company's profitability by indicating how much money a shareholder would receive for each share they own if all profits were distributed.
HALO Stocks: Heavy Asset, Low Obsolescence (HALO) stocks are uniquely positioned to withstand the persistent threat of AI disruption. HALO stocks are companies built on tangible, hard-to-replicate physical infrastructure and entrenched operating footprints, making their economic moats inherently resistant to breakthroughs in artificial intelligence.
Satellite: Satellite positions can consist of targeted, higher-risk, actively managed, or sector-specific investments (such as thematic ETFs, individual tech stocks, commodities, or high-yield bonds) aimed at generating outperformance (alpha).
Beta: Beta is an indicator of the price volatility of a stock or other asset in comparison with the broader market. It suggests the level of risk that an investor takes on in buying the stock. The higher the beta number, the higher the risk.
Correlation: A correlation tells you how two financial variables move together. Financial variables can be assets like stock prices, and bond yields or economic indicators like interest rates. The direction in which they move can be either positive (the same direction) or negative (the opposite direction). Correlations can be used in advanced portfolio management and range from +1.0 or the perfect positive correlation to -1.0 or the perfect negative correlation.
Risk-Free Rate/Return: A risk-free return refers to the expected return on an investment that carries absolutely no risk, typically exemplified by U.S. Treasury securities. In financial terms, it is used as a benchmark to measure the attractiveness of other investments.
Implied Growth Rate: An implied growth rate is the rate of growth backed out (inferred) from a stock's current market price or valuation model assuming the market is priced fairly.
Percentile: A percentile is a statistical measure that shows the value below which a given percentage of observations in a group fall
S&P 500:The S&P 500® is widely regarded as the best single gauge of large-cap U.S. equities and serves as the foundation for a wide range of investment products. The index includes 500 leading companies and captures approximately 80% coverage of available market capitalization.
S&P 500 Value Index: The S&P 500 Value Index is a capped float adjusted market capitalization weighted index. All the stocks in the underlying parent index are allocated into value or growth. Stocks that do not have pure value or pure growth characteristics have their market cap distributed between the value and growth indices. Prior to 12/19/2005, this index represented the S&P 500/Barra Value index.
S&P 500 Low Volatility Index: The S&P 500 Low Volatility Index is designed to measure the performance of the 100 least volatile stocks of the S&P 500 Index Volatility is defined as the standard deviation of the security computed using the daily price returns over 252 trading days.
Bloomberg 500 ex Magnificent 7 Price Return Index: Bloomberg 500 ex Magnificent 7 Price Return Index is a float market-cap weighted benchmark designed to measure the most highly capitalized US companies, excluding members of the Bloomberg Magnificent 7 Index.
S&P 600: The Standard & Poor's Smallcap 600 Index is a capitalization-weighted index that measures the performance of selected U.S. stocks with a small market capitalization. The index was developed with a base value of 100 as of December 31, 1993.
S&P 400: Standard and Poor's Midcap 400 Index is a capitalization-weighted index which measures the performance of the mid-range sector of the U.S. stock market. The index was developed with a base level of 100 as of December 31, 1990.
USGG10YR Index: Bloomberg's legacy generic on-the-run 10-year U.S. Treasury yield series. It represents the market yield of the current on-the-run 10-year U.S. Treasury note at each point in time. Bloomberg constructs a long historical series by rolling through successive on-the-run 10-year benchmark issues as they change over time.
USSGT10 Index: Bloomberg's legacy generic index for the U.S. 10-year Treasury Inflation-Protected Security (TIPS), representing a continuous 10-year TIPS real-yield series constructed by rolling through successive on-the-run 10-year TIPS yields over time. The real yield quoted here reflects the yield on inflation-linked cash flows under the street yield convention — it is interpreted as a real yield because the cash flows are treated as fixed from inception, independent of inflation.
USGGBE10 Index: Bloomberg's U.S. 10-year breakeven inflation rate series, used as a market-implied measure of inflation expectations over the next 10 years. It is calculated as the yield on a closest-maturity nominal U.S. Treasury minus the yield on a closest-maturity TIPS, using Bloomberg generic pricing. Because the methodology matches maturities using Bloomberg's own generic pricing, the exact nominal and TIPS legs used on any given date may differ from a simple manual subtraction of the two series above.
Options: An option is a contract sold by one party to another that gives the buyer the right, but not the obligation, to buy (call) or sell (put) a stock at an agreed upon price within a certain period or on a specific date.
Covered Call Strategy: A covered call strategy involves writing (selling) covered call options in return for the receipt of premiums. The seller of the option gives up the opportunity to benefit from price increases in the underlying instrument above the exercise price of the options, but continues to bear the risk of underlying instrument price declines.
Out-of-the-Money Options: Out-of-the-money options are options whose strike price is above the market price of the underlying asset.
0DTE Options: 0DTE (zero days to expiration) are options that are set to expire at the end of the trading day on which they are written.
Strike: Price at which the option holder may buy or sell the underlying security, as defined in the terms of the option contract.
Nasdaq-100 Index®: The Nasdaq-100 Index® is a globally recognized index that tracks the performance of 100 of the largest non-financial companies listed on the Nasdaq Stock Market®, encompassing a diverse range of industries and sectors. The components of the Nasdaq-100 Index® are weighted pursuant to their market capitalization. The index is rebalanced quarterly and reconstituted annually.
Market Commentary Disclosures
This information is provided solely as general investment education. None of the information provided should be regarded as a suggestion to engage in or refrain from any investment related course of action. Investing involves risk, loss of principal is possible.
Not an offer: This document does not constitute advice or a recommendation or offer to sell or a solicitation to deal in any security or financial product. It is provided for information purposes only and on the understanding that the recipient has sufficient knowledge and experience to be able to understand and make their own evaluation of the proposals and services described herein, any risks associated therewith and any related legal, tax, accounting or other material considerations. To the extent that the reader has any questions regarding the applicability of any specific issue discussed above to their specific portfolio or situation, prospective investors are encouraged to contact 1-855-561-5728 or consult with the professional advisor of their choosing.
Forward-looking statements: Certain information contained herein constitutes “forward-looking statements,” which can be identified by the use of forward-looking terminology such as “may,” “will,” “should,” “expect,” “anticipate,” “project,” “estimate,” “intend,” “continue,” or “believe,” or the negatives thereof or other variations thereon or comparable terminology. Due to various risks and uncertainties, actual events, results or actual performance may differ materially from those reflected or contemplated in such forward-looking statements. Nothing contained herein may be relied upon as a guarantee, promise, assurance or a representation as to the future.
Use of Third-party Information: Certain information contained herein has been obtained from third party sources and such information has not been independently verified by Roundhill Financial Inc. No representation, warranty, or undertaking, expressed or implied, is given to the accuracy or completeness of such information by Roundhill Financial Inc. or any other person. While such sources are believed to be reliable, Roundhill Financial Inc. does not assume any responsibility for the accuracy or completeness of such information. Roundhill Financial Inc. does not undertake any obligation to update the information contained herein as of any future date.
Any indices and other financial benchmarks shown are provided for illustrative purposes only, are unmanaged, reflect reinvestment of income and dividends and do not reflect the impact of advisory fees. Investors cannot invest directly in an index.
Except where otherwise indicated, the information contained in this presentation is based on matters as they exist as of the date of preparation of such material and not as of the date of distribution or any future date. Recipients should not rely on this material in making any future investment decision. The performance data quoted represents past performance. Past performance does not guarantee future results. Current performance may be lower or higher than the performance data quoted.
CHAT Disclosures
Roundhill Generative AI & Technology ETF (CHAT)
Gross Expense Ratio: 0.75%
Investment Objective: The Roundhill Generative AI & Technology ETF seeks long-term capital appreciation.
Investors should consider the investment objectives, risk, charges and expenses carefully before investing. For a prospectus or summary prospectus with this and other information about Roundhill ETFs please call 1-855-561-5728 or visit the website at www.roundhillinvestments.com/etf/. Read the prospectus or summary prospectus carefully before investing.
Artificial Intelligence Company Risk. Companies involved in, or exposed to, artificial intelligence related businesses may have limited product lines, markets, financial resources or personnel. These companies face intense competition and potentially rapid product obsolescence, and many depend significantly on retaining and growing the consumer base of their respective products and services.
Technology Sector Risk. The Fund will invest substantially in companies in the information technology sector, and therefore the performance of the Fund could be negatively impacted by events affecting this sector. Market or economic factors impacting technology companies and companies that rely heavily on technological advances could have a significant effect on the value of the Fund’s investments. The value of stocks of information technology companies and companies that rely heavily on technology is particularly vulnerable to rapid changes in technology product cycles, rapid product obsolescence, government regulation and competition, both domestically and internationally, including competition from foreign competitors with lower production costs.
Small-Capitalization Investing. The securities of small-capitalization companies may be more vulnerable to adverse issuer, market, political, or economic developments than securities of large- or mid-capitalization companies. The securities of small capitalization companies generally trade in lower volumes and are subject to greater and more unpredictable price changes than large- or mid-capitalization stocks or the stock market as a whole.
Micro-Capitalization Investing. Micro-capitalization companies often have limited product lines, narrower markets for their goods and/or services and more limited managerial and financial resources than larger, more established companies, including companies which are considered small- or mid-capitalization.
Concentration Risk. The Fund will be concentrated in securities of issuers having their principal business activities in the technology group of industries. To the extent that the Fund concentrates in a group of industries, it will be subject to the risk that economic, political, or other conditions that have a negative effect on that group of industries will negatively impact them to a greater extent than if its assets were invested in a wider variety of industries.
CHAT is distributed by Foreside Fund Services, LLC.
MAGS Disclosures
Roundhill Magnificent Seven ETF (MAGS)
Gross Expense Ratio: 0.30%
Investment Objective: The Roundhill Magnificent Seven ETF seeks growth of capital.
Investors should consider the investment objectives, risk, charges and expenses carefully before investing. For a prospectus or summary prospectus with this and other information about Roundhill ETFs please call 1-855-561-5728 or visit the website at www.roundhillinvestments.com/etf/MAGS. Read the prospectus or summary prospectus carefully before investing.
Investing involves risk, including possible loss of principal. The Fund expects to have concentrated (i.e., invest more than 25% of its net assets) investment exposure in one or more of the Technology Industries at any given time, which may vary over time. Further, the Fund expects to obtain such investment exposure by transacting primarily with a limited number of financial intermediaries conducting business in the same industry or group of related industries. As a result, the Fund is more vulnerable to adverse market, economic, regulatory, political or other developments affecting those industries or groups of related industries than a fund that invests its assets in a more diversified manner. The value of stocks of information technology companies and companies that rely heavily on technology is particularly vulnerable to rapid changes in technology product cycles. Please see the summary and full prospectuses for a more complete description of these and other risks of the Fund.
Roundhill Financial Inc. serves as the investment advisor. The Funds are distributed by Foreside Fund Services, LLC which is not affiliated with Roundhill Financial Inc., U.S. Bank, or any of their affiliates.
QDTE Disclosures
Roundhill Nasdaq-100® 0DTE Covered Call Strategy ETF (QDTE)
Gross Expense Ratio: 0.96%
Investment Objective: The Fund’s primary investment objective is to provide current income. The Fund’s secondary investment objective is to provide capital appreciation.
Investors should consider the investment objectives, risks, charges, and expenses carefully before investing. For a prospectus or summary prospectus, if available, with this and other information about the Fund, please call 1-855-561-5728 or visit our website at https://www.roundhillinvestments.com/etf/QDTE. Read the prospectus or summary prospectus carefully before investing.
All investing involves risk, including the risk of loss of principal. There is no guarantee the investment strategy will be successful. For a detailed list of fund risks see the prospectus.
Covered Call Strategy Risk. A covered call strategy involves writing (selling) covered call options in return for the receipt of premiums. The seller of the option gives up the opportunity to benefit from price increases in the underlying instrument above the exercise price of the options, but continues to bear the risk of underlying instrument price declines. The premiums received from the options may not be sufficient to offset any losses sustained from underlying instrument price declines. Exchanges may suspend the trading of options during periods of abnormal market volatility. Suspension of trading may mean that an option seller is unable to sell options at a time that may be desirable or advantageous to do so.
Additionally, the Fund is a “synthetic” covered call strategy, meaning that it derives its long exposure to the Nasdaq-100 Index® from options that utilize the Nasdaq-100 Index® as the reference asset. This synthetic exposure increases the likelihood that the Fund’s returns may not always precisely align with the returns of the Nasdaq-100 Index®.
Options Risk. The use of options involves investment strategies and risks different from those associated with ordinary portfolio securities transactions and depends on the ability of the Fund’s portfolio managers to forecast market movements correctly. The prices of options are volatile and are influenced by, among other things, actual and anticipated changes in the value of the underlying instrument, or in interest or currency exchange rates, including the anticipated volatility, which in turn are affected by fiscal and monetary policies and by national and international political and economic events. The effective use of options also depends on the Fund’s ability to terminate option positions at times deemed desirable to do so. There is no assurance that the Fund will be able to effect closing transactions at any particular time or at an acceptable price. In addition, there may at times be an imperfect correlation between the movement in values of options and their underlying securities and there may at times not be a liquid secondary market for certain options. Lastly, the trading of options is subject to transaction costs that may impact the Fund’s returns.
FLEX Options Risk. Trading FLEX Options involves risks different from, or possibly greater than, the risks associated with investing directly in securities. The Fund may experience losses from specific FLEX Option positions and certain FLEX Option positions may expire worthless. The FLEX Options are listed on an exchange; however, no one can guarantee that a liquid secondary trading market will exist for the FLEX Options.
0DTE Options Risk. The Fund’s use of zero days to expiration, known as “0DTE” options, presents additional risks. Due to the short time until their expiration, 0DTE options are more sensitive to sudden price movements and market volatility than options with more time until expiration. Because of this, the timing of trades utilizing 0DTE options becomes more critical. Although the Fund intends to enter into 0DTE options trades on market open, or shortly thereafter, even a slight delay in the execution of these trades can significantly impact the outcome of the trade. Such options may also suffer from low liquidity, making it more difficult for the Fund to enter into its positions each morning at desired prices. The bid-ask spreads on 0DTE options can be wider than with traditional options, increasing the Fund’s transaction costs and negatively affecting its returns. Additionally, the proliferation of 0DTE options is relatively new and may therefore be subject to rule changes and operational frictions. To the extent that the OCC enacts new rules relating to 0DTE options that make it impractical or impossible for the Fund to utilize 0DTE options to effectuate its investment strategy, it may instead utilize options with the shortest remaining maturity available or it may utilize swap agreements to provide the desired exposure.
New Fund Risk. The fund is new and has a limited operating history.
Derivatives Risk. The use of derivative instruments (i.e. options contracts) involves risks different from, or possibly greater than, the risks associated with investing directly in securities and other traditional investments.
Distribution Tax Risk. The Fund currently expects to make distributions on a weekly basis. These distributions may exceed the Fund’s income and gains for the Fund’s taxable year. Distributions in excess of the Fund’s current and accumulated earnings and profits will be treated as a return of capital.
Nasdaq-100 Index® Risks. The Fund will have significant exposure to the Nasdaq-100 Index® through its investments in options that utilize the Nasdaq-100 Index® as the reference asset.
Roundhill Financial Inc. serves as the investment advisor. The Funds are distributed by Foreside Fund Services, LLC which is not affiliated with Roundhill Financial Inc., U.S. Bank, or any of their affiliates.
LYTE Disclosures
Roundhill Photonics & Optics ETF (LYTE)
Gross Expense Ratio: 0.65%
Investment Objective: The Fund seeks to provide capital appreciation.
Investors should consider the investment objectives, risks, charges, and expenses carefully before investing. For a prospectus or summary prospectus, if available, with this and other information about the Fund, please call 1-855-561-5728 or visit our website at www.roundhillinvestments.com/etf/LYTE. Read the prospectus or summary prospectus carefully before investing.
Photonic and Optical Companies Risk. Photonic and Optical Companies may be subject to rapid changes in technology, intense competition, government regulation, and obsolescence risk. Securities of such companies may be subject to greater price volatility than securities of companies in other sectors, particularly over the short term. The prices of securities of companies in these industries may fluctuate widely due to competitive pressures, rapid product cycles, changes in the regulatory environment, and shifts in supply and demand dynamics. Many Photonic and Optical Companies are relatively small and may have limited product lines, markets, financial resources, or personnel, making them more susceptible to business risks and adverse developments. Photonic and Optical Companies may also be dependent upon government contracts or subsidies, which may be subject to cancellation, renegotiation, or delay in payment. Additionally, the development and commercialization of photonic and optical technologies may be contingent upon the broader adoption of related technologies, including artificial intelligence, data center infrastructure, and advanced telecommunications networks. A slowdown or disruption in the growth of these related sectors could materially and adversely affect the revenues and profitability of Photonic and Optical Companies in which the Fund invests.
Line of Business Risk. Certain companies included in the Fund’s portfolio will be engaged in other lines of business unrelated to the development of optical and/or photonic products, and these lines of business could adversely affect their operating results. The operating results of these companies may fluctuate as a result of these additional risks and events in the other lines of business. Despite a company’s possible success in activities linked to its development of optical and/or photonic products, there can be no assurance that the other lines of business in which these companies are engaged will not have an adverse effect on a company’s business or financial condition.
Active Management Risk. The Fund is actively-managed and its performance reflects investment decisions that the Adviser and/or Sub-Adviser makes for the Fund. Such judgments about the Fund’s investments may prove to be incorrect. If the investments selected and the strategies employed by the Fund fail to produce the intended results, the Fund could underperform as compared to other funds with similar investment objectives and/or strategies, or could have negative returns.
Asia Risk. The Fund invests significantly in the securities of Asian issuers. As such, the Fund is subject to certain risks specifically associated with investments in the securities of Asian issuers. Many Asian economies have experienced rapid growth and industrialization, and there is no assurance that this growth rate will be maintained. Some Asian economies are highly dependent on trade, and economic conditions in other countries within and outside Asia can impact these economies. Certain of these economies may be adversely affected by trade or policy disputes with its major trade partners. There is also a high concentration of market capitalization and trading volume in a small number of issuers representing a limited number of industries, as well as a high concentration of investors and financial intermediaries. Certain Asian countries have experienced and may in the future experience expropriation and nationalization of assets, confiscatory taxation, currency manipulation, political instability, armed conflict and social instability as a result of religious, ethnic, socio-economic and/or political unrest. In particular, escalated tensions involving North Korea and any outbreak of hostilities involving North Korea could have a severe adverse effect on Asian economies. Governments of certain Asian countries have exercised, and continue to exercise, substantial influence over many aspects of the private sector. In certain cases, the government owns or controls many companies, including the largest in the country. Accordingly, government actions could have a significant effect on the issuers of the Fund’s securities or on economic conditions generally. Recent developments in relations between the U.S. and China have heightened concerns of increased tariffs and restrictions on trade between the two countries. An increase in tariffs or trade restrictions, or even the threat of such developments, could lead to a significant reduction in international trade, which could have a negative impact on the economy of Asian countries and a commensurately negative impact on the Fund.
Concentration Risk. The Fund is concentrated in the industry or group of industries comprising the information technology sector. The Fund may be susceptible to an increased risk of loss, including losses due to adverse events that affect the Fund’s investments more than the market as a whole, to the extent that the Fund’s investments are concentrated in the securities and/or other assets of a particular issuer or issuers, country, group of countries, region, market, industry, group of industries, sector, market segment or asset class.
Depositary Receipts Risk. Depositary receipts may be less liquid than the underlying shares in their primary trading market. Any distributions paid to the holders of depositary receipts are usually subject to a fee charged by the depositary. Holders of depositary receipts may have limited voting rights, and investment restrictions in certain countries may adversely impact the value of depositary receipts because such restrictions may limit the ability to convert the equity shares into depositary receipts and vice versa. Such restrictions may cause the equity shares of the underlying issuer to trade at a discount or premium to the market price of the depositary receipts.
Information Technology Companies Risk. Information technology companies face intense competition, both domestically and internationally, which may have an adverse effect on profit margins. Like other technology companies, information technology companies may have limited product lines, markets, financial resources or personnel. The products of information technology companies may face obsolescence due to rapid technological developments, frequent new product introduction, unpredictable changes in growth rates and competition for the services of qualified personnel. Companies in the information technology sector are heavily dependent on patent and intellectual property rights. The loss or impairment of these rights may adversely affect the profitability of these companies. Information technology companies are facing increased government and regulatory scrutiny and may be subject to adverse government or regulatory action.
International Closed Market Trading Risk. To the extent securities held by the Fund trade on non-U.S. exchanges that are closed when the Fund’s primary listing exchange is open, there are likely to be deviations between the current price of an underlying security and the last quoted price for the underlying security (i.e., the Fund’s quote from the closed foreign market) used for purposes of calculating the Fund’s NAV, resulting in premiums or discounts to the Fund’s NAV and bid/ask spreads that may be greater than those experienced by other funds. In addition, shareholders may not be able to purchase and sell shares of the Fund on days when the NAV of the Fund could be significantly affected by events in the relevant foreign markets (e.g., market holidays, market trading halts or significant volatility in foreign markets).
New Fund Risk. The Fund is a recently organized investment company with a limited operating history. As a result, prospective investors have a limited track record or history on which to base their investment decision.
Non-Diversification Risk. As a “non-diversified” fund, the Fund may hold a smaller number of portfolio securities than many other funds. To the extent the Fund invests in a relatively small number of issuers, a decline in the market value of a particular security held by the Fund may affect its value more than if it invested in a larger number of issuers. The value of the Fund Shares may be more volatile than the values of shares of more diversified funds.
Swap Agreements Risk. The Fund may utilize swap agreements to derive its exposure to Photonic and Optical Companies. Swap agreements may involve greater risks than direct investment in securities as they may be leveraged and are subject to credit risk, counterparty risk and valuation risk. A swap agreement could result in losses if the underlying reference or asset does not perform as anticipated. In addition, many swaps trade over-the-counter and may be considered illiquid. It may not be possible for the Fund to liquidate a swap position at an advantageous time or price, which may result in significant losses.
Roundhill Financial Inc. serves as the investment advisor. The Funds are distributed by Foreside Fund Services, LLC which is not affiliated with Roundhill Financial Inc., U.S. Bank, or any of their affiliates.
LOHA Disclosures
Roundhill HALO ETF (LOHA)
Gross Expense Ratio: 0.35%
Investment Objective: The Fund seeks to provide capital appreciation.
Investors should consider the investment objectives, risk, charges and expenses carefully before investing. For a prospectus or summary prospectus with this and other information about Roundhill ETFs please call 1-855-561-5728 or visit the website at www.roundhillinvestments.com/etf/LOHA. Read the prospectus or summary prospectus carefully before investing.
HALO Companies Risk. The Fund will invest substantially all of its assets in companies identified by the Index Provider as HALO Companies. U.S.-listed companies whose economic value is anchored to tangible physical assets, real-world operations, and long-established brand and infrastructure moat. As a result, the Fund’s performance will be disproportionately exposed to the risks inherent HALO Companies. HALO Companies typically require significant ongoing capital expenditures to maintain, upgrade and expand their infrastructure, and their financial performance may be adversely affected by rising construction costs, supply chain disruptions, labor shortages, equipment failures, and delays in permitting or project completion. Because these companies often rely on substantial debt financing to fund assets, they may be particularly sensitive to changes in interest rates, credit availability, and broader capital market conditions, which could increase borrowing costs, reduce refinancing flexibility, and compress equity valuations. Many HALO Companies operate in regulated or quasi-regulated industries, and adverse regulatory actions, changes in tariff structures, environmental compliance mandates, or shifts in public policy may materially affect revenues, returns on invested capital, or asset values. Although HALO Companies are generally thought to be characterized by a lower risk technological obsolescence, they may nonetheless face disruption from evolving energy technologies, changes in consumer behavior, decarbonization initiatives, or alternative infrastructure solutions that impair the economic usefulness of legacy assets. The direction of technology is ultimately unknowable and companies thought to be subject to lower risk of technological obsolescence may nonetheless find their business models increasingly obsolete. In addition, the long-duration nature of their assets and cash flows may make HALO Companies more sensitive to inflation expectations and interest rate changes. Because the Fund’s strategy emphasizes a particular class of companies with similar structural characteristics, it may underperform broader equity markets, particularly during periods in which asset-light, technology-oriented, or higher-growth companies outperform capital-intensive sectors. Consequently, an investment in the Fund involves heightened risks associated with investing in companies selected for HALO characteristics and may experience greater volatility or sustained periods of underperformance relative to diversified equity funds that are not focused on such companies.
Industrials Sector Risk. The value of securities issued by companies in the industrials sector may be adversely affected by supply and demand changes related to their specific products or services and industrials sector products in general. The products of manufacturing companies may face obsolescence due to rapid technological developments and frequent new product introduction. Global events, trade disputes and changes in government regulations, economic conditions and exchange rates may adversely affect the performance of companies in the industrials sector. Companies in the industrials sector may be adversely affected by liability for environmental damage and product liability claims. The industrials sector may also be adversely affected by changes or trends in commodity prices, which may be influenced by unpredictable factors. Companies in the industrials sector, particularly aerospace and defense companies, may also be adversely affected by government spending policies because companies in this sector tend to rely to a significant extent on government demand for their products and services.
Concentration Risk. The Fund may be susceptible to an increased risk of loss, including losses due to adverse events that affect the Fund’s investments more than the market as a whole, to the extent that the Fund’s investments are concentrated in the securities and/or other assets of a particular issuer or issuers, country, group of countries, region, market, industry, group of industries, sector, market segment or asset class.
Index Provider Risk. There is no assurance that the Index Provider, or any agents that act on its behalf, will compile the Index accurately, or that the Index will be determined, maintained, constructed, reconstituted, rebalanced, composed, calculated or disseminated accurately. The Index Provider and its agents do not provide any representation or warranty in relation to the quality, accuracy or completeness of data in the Index, and do not guarantee that the Index will be calculated in accordance with its stated methodology.
New Fund Risk. The Fund is a recently organized investment company with a limited operating history. As a result, prospective investors have a limited track record or history on which to base their investment decision.
Non-Diversification Risk. As a “non-diversified” fund, the Fund may hold a smaller number of portfolio securities than many other funds. To the extent the Fund invests in a relatively small number of issuers, a decline in the market value of a particular security held by the Fund may affect its value more than if it invested in a larger number of issuers. The value of the Fund Shares may be more volatile than the values of shares of more diversified funds.
Roundhill Financial Inc. serves as the investment advisor. The Funds are distributed by Foreside Fund Services, LLC which is not affiliated with Roundhill Financial Inc., U.S. Bank, or any of their affiliates.