Overview
In the last couple years, plenty of single stock covered call ETFs have hit the market. Most funds have targeted underlying exposures with substantial implied volatility levels, and while the premiums look enticing, investors have begun to question how these ETFs can underperform the underlying stock return.
In this blog, we will:
- Help you understand that covered call strategies are not a bullish investment vehicle
- Identify why underperformance is occurring
- Explore other derivative methods which may be better suited for investors looking to get bullish exposure to a single stock while maintaining consistent cashflow generation
In order to do so, we’ll need to back up into a brief 101 on leverage and delta.
Can I have more for less?
Say an investor wants to create a long position in a stock. One way to do so would be to purchase the stock for cash. It would cost 100% of the price of the equity. However, what if the investor didn’t have to spend 100% to get the same exposure? That is leverage. Leverage, in the context of capital markets, allows traders to create larger position sizes using a smaller amount of capital.
Options are one form of leverage. An investor could purchase a call option and sell a put option with the same strike, spending much less money to acquire the same exposure as purchasing “physical” stock. Looking at it another way, that investor could spend 100% of their capital purchasing many, many contracts of this call-put combo (generally known as a bullish/long forward), and create a substantially larger exposure to the underlying stock than buying shares for cash.
Swaps are another avenue to acquire leverage. They are not as well known to the retail community as they trade over-the-counter (OTC), unlike options which generally trade in listed markets. A swap is an OTC product in which the buyer pays a bank to purchase or short a security for a given period of time, and, in exchange, the performance of that security is swapped at the end of the trade’s tenor. For example, if an investor bought the S&P 500 Index on swap, and the S&P 500 Index rallied 5% during the tenor of the trade, the bank/counterparty would then pay that investor 5% at expiry. If the investor instead went short S&P 500 Index on swap, then the investor would owe the bank 5% at expiry. What does a swap cost? It depends on the cost of the bank to hold the exposure on their balance sheet and how difficult it is to borrow/lend that security.
What is delta?
Delta is one of the option greeks. It measures an option’s sensitivity to the underlying asset price. For example, if an investor owns a call option on XYZ with a +50% delta, for every $1 increase in XYZ, they can expect a $0.50 increase in the price of their option.
Delta, like all other option greeks, is directional.
- Purchasing a call option and selling a put option (also known as a synthetic long when combined) are both long/positive delta.
- Conversely, selling a call option and buying a put option (a synthetic short when combined) are both short/negative delta.
If the investor instead sold the call option on XYZ, their option price would decrease $0.50 for every $1 increase in the underlying stock price.
|
|
Put (Bearish) |
Call (Bullish) |
|
Short (Bearish) |
Positive Delta |
Negative Delta |
|
Long (Bullish) |
Negative Delta |
Positive Delta |
In essence, delta tells us how much our position's value will move for a $1 move in the underlying stock. If I own a stock and then sell an out-of-the-money call option on it, my stock delta is +100% and the short call option delta is negative, let’s call it -30%. The combination of these two positions creates a total delta exposure of +70% at inception of the trade.
It’s important to note that deltas are not stagnant – they will move as the underlying stock price moves around the option strike. That relationship of delta to stock price is depicted below in the delta curve. As an option gets further out-of-the-money, its delta gets smaller in magnitude until it reaches 0. As an option gets further in-the-money, its delta grows to +/-100%. An at-the-money option will have a 50% delta.
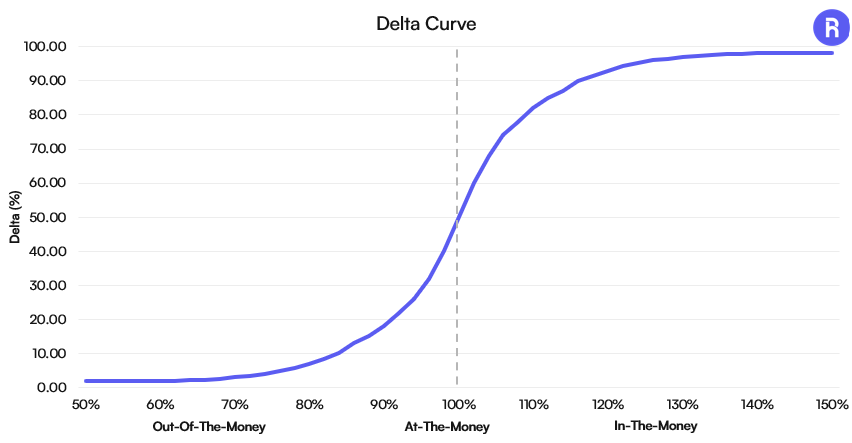
Source: Roundhill Investments, for illustrative purposes only
Why is all this information important? Lets take a look at the economics of a covered call strategy.
What do you mean “capped upside”?
As mentioned earlier, a short call is a short delta position and that delta will change as the underlying stock moves around the strike. A long stock position will always be 100% delta, as its performance is identical to the price movements of the stock. Therefore, in a covered call position, as the stock moves toward the strike (appreciates in price), the short delta will grow and the total position delta (option + cash stock) will shrink. When the option is sufficiently in-the-money and trading at a -100% delta, the long cash position and short option positions deltas will be offset, and the upside will be capped. This payoff is depicted below.
As you can see, the Net Exposure line (option + stock) has little-to-no sensitivity to the underlying asset as the stock moves higher.
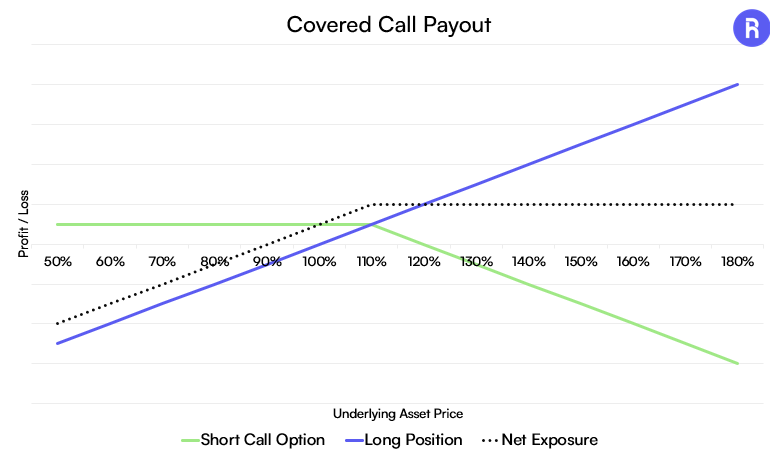
Source: Roundhill Investments, for illustrative purposes only
If upside is capped, why are covered call positions so popular on sentimentality bullish stocks like Nvidia (NVDA) and Tesla (TSLA)? Because on an initial look the volatility looks very attractive. Selling a 1-month 105% strike TSLA call yields 3.8% in premium.1 However, that volatility is only beneficial if the realized volatility of the stock is lower than the option’s implied volatility and the stock remains below call strike. If the stock outperforms volatility market expectations (realized vol > implied vol), the investor loses money by capping their upside as opposed to holding the cash stock outright. This phenomenon is depicted below by looking at implied vs realized volatility levels on TSLA.
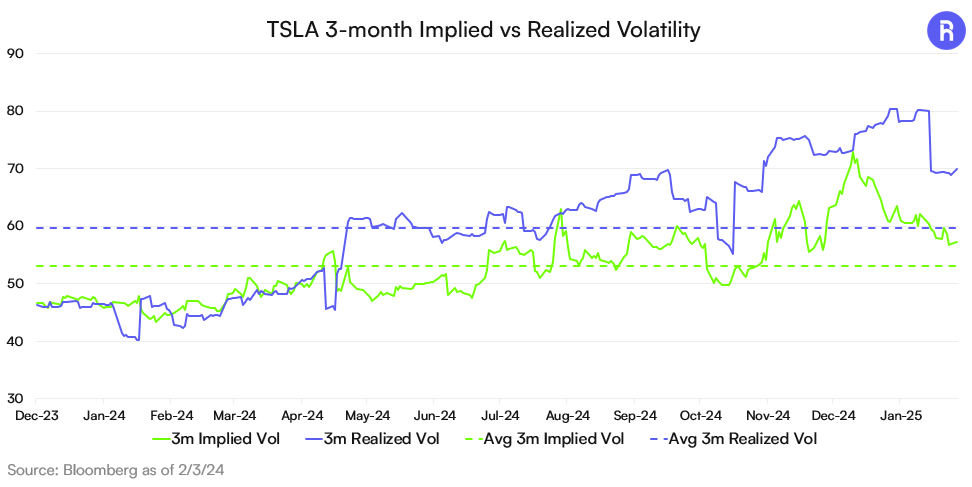
This rationale tends to be why covered call strategies on indices and ETFs, which operate at a lower level of volatility, tend to have more stable total return profiles.
A bullish view AND cash generation
Is it possible to express a bullish view while providing consistent cash payments to investors without reducing sensitivity to moves higher in the underlying stock? Enter the Roundhill WeeklyPay™ suite.
As we discussed earlier, there are other methods of generating leverage. As opposed to utilizing options, the WeeklyPay™ suite employs swaps to synthetically create 1.2X weekly leverage to the single stock within each ETF. You can think of 1.2X leverage as being similar to owning a +120% delta position: for each $1 increase in the stock price, your position will increase by $1.20. Conversely, for each $1 decrease in the stock price, your position will decrease by $1.20. That is a bullish delta. The payoff of this leverage is denoted in the graphic below.
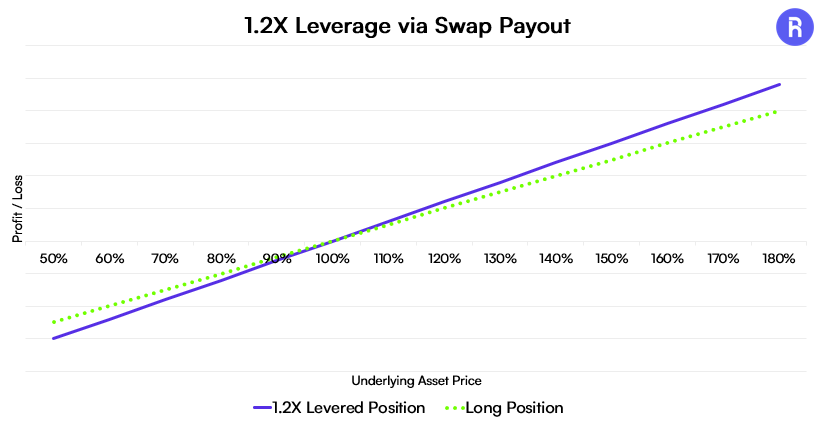
Source: Roundhill Investments, for illustrative purposes only
How does this ETF distribute cash? Roundhill has designed a set of parameters based on both implied volatility and weekly stock performance to determine ETF distributions, which will be distributed to ETF holders on a weekly basis.
In conclusion…
Both covered call and levered weekly distribution strategies can generate favorable returns, but they generate favorable returns in different market environments. Covered call strategies tend to outperform the benchmark in down-to-neutral market conditions, and they underperform in up markets. Whereas, a levered weekly distribution strategy will outperform the benchmark in up markets and underperform in down-to-neutral markets. Investors should be aware of and consider the payoff profile of each strategy when making their investment decisions.
Glossary
Call Option: A call option gives the buyer the right, but not the obligation, to buy the underlying asset at a specified strike price before the option's expiration date. For example, uou buy a call option with a strike price of $50 on ABC stock. If ABC stock rises to $60, you can buy it at $50, profiting from the difference. If the stock does not rise above $50, your option expires worthless and the premium paid is lost.
Put Option: A put option gives the buyer the right, but not the obligation, to sell the underlying asset at a specified strike price before expiration. For example, you buy a put option with a strike price of $50 on XYZ stock. If XYZ stock falls to $40, you can sell it at $50, profiting from the difference. If the stock does not fall below $50, your option expires worthless and the premium paid is lost.
In-the-Money Option (ITM): An option is in-the-money if it would be profitable to exercise it immediately. For a call option, this means the stock price is above the strike price. For a put option, this means the stock price is below the strike price.
Out-of-the-Money Option (OTM): An option is out-of-the-money if it would not be profitable to exercise it immediately. For a call option, this means the stock price is below the strike price. For a put option, this means the stock price is above the strike price.
Implied Volatility: Implied volatility measures the market's expectation of the future volatility of a stock or asset, derived from options prices. It reflects how much the market thinks the stock will move, expressed as an annualized percentage.
Realized Volatility: Realized volatility is the actual observed volatility of a stock or asset over a past period, calculated using historical price data. It measures the actual magnitude of price movements, typically expressed as an annualized standard deviation.
--
Investors should consider the investment objectives, risks, charges, and expenses carefully before investing. For a prospectus or summary prospectus, if available, with this and other information about the Fund, please call 1-855-561-5728 or visit our website at https://www.roundhillinvestments.com/etf/. Read the prospectus or summary prospectus carefully before investing.
The Funds are not suitable for all investors. They are only suitable for knowledgeable investors who understand how the Funds operate and for those investors who actively monitor and manage their investments. Investors who do not understand a Fund’s strategy and the returns that it seeks to provide, or do not intend to actively monitor and manage their investment in a Fund, should not invest in a Fund.
There is no assurance that a Fund will achieve its weekly leveraged investment objective. Additionally, an investment in a Fund could lose money, including the full principal value of his/her investment within a single week. An investor for whom these stipulations are not acceptable should not invest in a Fund.
There is no guarantee that these Funds will successfully provide returns that correspond to approximately 1.2 times (120%) the calendar week total return of the stocks they track.
The Funds will provide exposure to the weekly total returns of the stocks they track. Accordingly, the Funds are not an appropriate investment for investors seeking exposure to the daily total return of the stocks they track.
The Funds are classified as “non-diversified” under the Investment Company Act of 1940 (the “1940 Act”).
It is critical that investors understand the following:
- An investment in the Fund is not an investment in the underlying stock.
- Each Fund’s strategy is subject to all potential losses of the tracked stock. If the tracked stock shares decrease in value, the Fund may lose all of its value if shares of the tracked stock decrease by 83.33 percent over the course of any calendar week.
Issuer Specific Risks. Issuer-specific attributes may cause an investment held by the Fund to be more volatile than the market generally. The value of an individual security or particular type of security may be more volatile than the market as a whole and may perform differently from the value of the market as a whole.
Derivatives Risk. The use of derivative instruments involves risks different from, or possibly greater than, the risks associated with investing directly in securities and other traditional investments.
Distribution Tax Risk. The Fund currently expects to make distributions on a weekly basis. Such frequent distributions may expose investors to increased tax liabilities. However, these distributions may exceed the Fund’s income and gains for the Fund’s taxable year. Distributions in excess of the Fund’s current and accumulated earnings and profits will be treated as a return of capital.
Leverage Risk. The Fund obtains investment exposure in excess of its net assets by utilizing leverage and may lose more money in market conditions that are adverse to its investment objective than a fund that does not utilize leverage. An investment in the Fund is exposed to the risk that a decline in the weekly performance of shares of the security indicated by the Fund’s name will be magnified.
Swap Agreements Risk. The Fund will utilize swap agreements to derive its exposure to shares of the security indicated by the Fund’s name. Swap agreements may involve greater risks than direct investment in securities as they may be leveraged and are subject to credit risk, counterparty risk and valuation risk. A swap agreement could result in losses if the underlying reference or asset does not perform as anticipated. In addition, many swaps trade over-the-counter and may be considered illiquid. It may not be possible for the Fund to liquidate a swap position at an advantageous time or price, which may result in significant losses.
Concentration Risk. The Fund is susceptible to an increased risk of loss, including losses due to adverse events that affect the Fund’s investments more than the market as a whole, to the extent that the Fund’s investments are concentrated in investments that provide exposure to of the security indicated by the Fund’s name and the industry to which it is assigned.
Active Management Risk. The Fund is actively-managed and its performance reflects investment decisions that the Adviser and/or Sub-Adviser makes for the Fund. Such judgments about the Fund’s investments may prove to be incorrect. If the investments selected and the strategies employed by the Fund fail to produce the intended results, the Fund could underperform as compared to other funds with similar investment objectives and/or strategies, or could have negative returns.
New Fund Risk. The Fund is new and has a limited operating history.
Non-Diversification Risk. As a "non-diversified" fund, the Fund may hold a smaller number of portfolio securities than many other funds.
Roundhill Financial Inc. serves as the investment advisor. The Funds are distributed by Foreside Fund Services, LLC which is not affiliated with Roundhill Financial Inc., U.S. Bank, or any of their affiliates.
Sources:
1 Bloomberg as of 2/5/2025