A Case Against the AI Bubble
The magnitude and speed of recent gains in AI stocks have naturally reignited comparisons to the late 1990s dotcom boom and subsequent bust. While skepticism is understandable, we believe the comparison is off the mark.

Bloomberg Businessweek January 2026
By both price and fundamental measures, we believe the current AI cycle does not exhibit the hallmarks of a speculative excess. Instead, the data point toward a broad-based productivity shock that is already translating into higher profitability, expanding margins, and improving cash flow dynamics.
Why the Bubble Narrative Is Gaining Traction
AI stocks have materially outperformed the broader market over the past several years. This divergence, combined with elevated valuation multiples, has heightened investor sensitivity to downside risk and raised questions about sustainability.
 *You cannot invest in an index. The performance data quoted represents past performance. Past performance does not guarantee future results. Current performance may be lower or higher than the performance data quoted. The investment return and principal value of an investment will fluctuate so that an investor's shares, when sold or redeemed, may be worth more or less than their original cost. Returns less than one year are not annualized. For the most recent month-end performance, please call (855) 561-5728. For more information, including current holdings and standardized performance: https://www.roundhillinvestments.com/etf/chat/
Strong relative performance explains investor concern, but performance alone is insufficient to conclude that valuations are detached from fundamentals.
Is The Dotcom Era the Right Historical Parallel?
The magnitude of the AI rally has inevitably drawn comparisons to technology booms of the past, specifically the late 1990s dotcom bubble. However, a critical difference exists when examining the difference in the market cap weight and overall earnings contribution.
During the dotcom era, the S&P 500 Technology sector reached almost 35% in its market cap weight within the S&P 500 with significantly less profits to support the underlying price surge. This was one of the critical disparities that led to the dotcom bubble bursting: euphoria rewarded low quality companies that couldn’t justify the valuations.
Today, AI is once again driving the Technology sector to record price levels, but with its share of total S&P 500 profits at historic highs (~20%). The disparity between market cap weight and earnings weight is much less than it was in March of 2000.
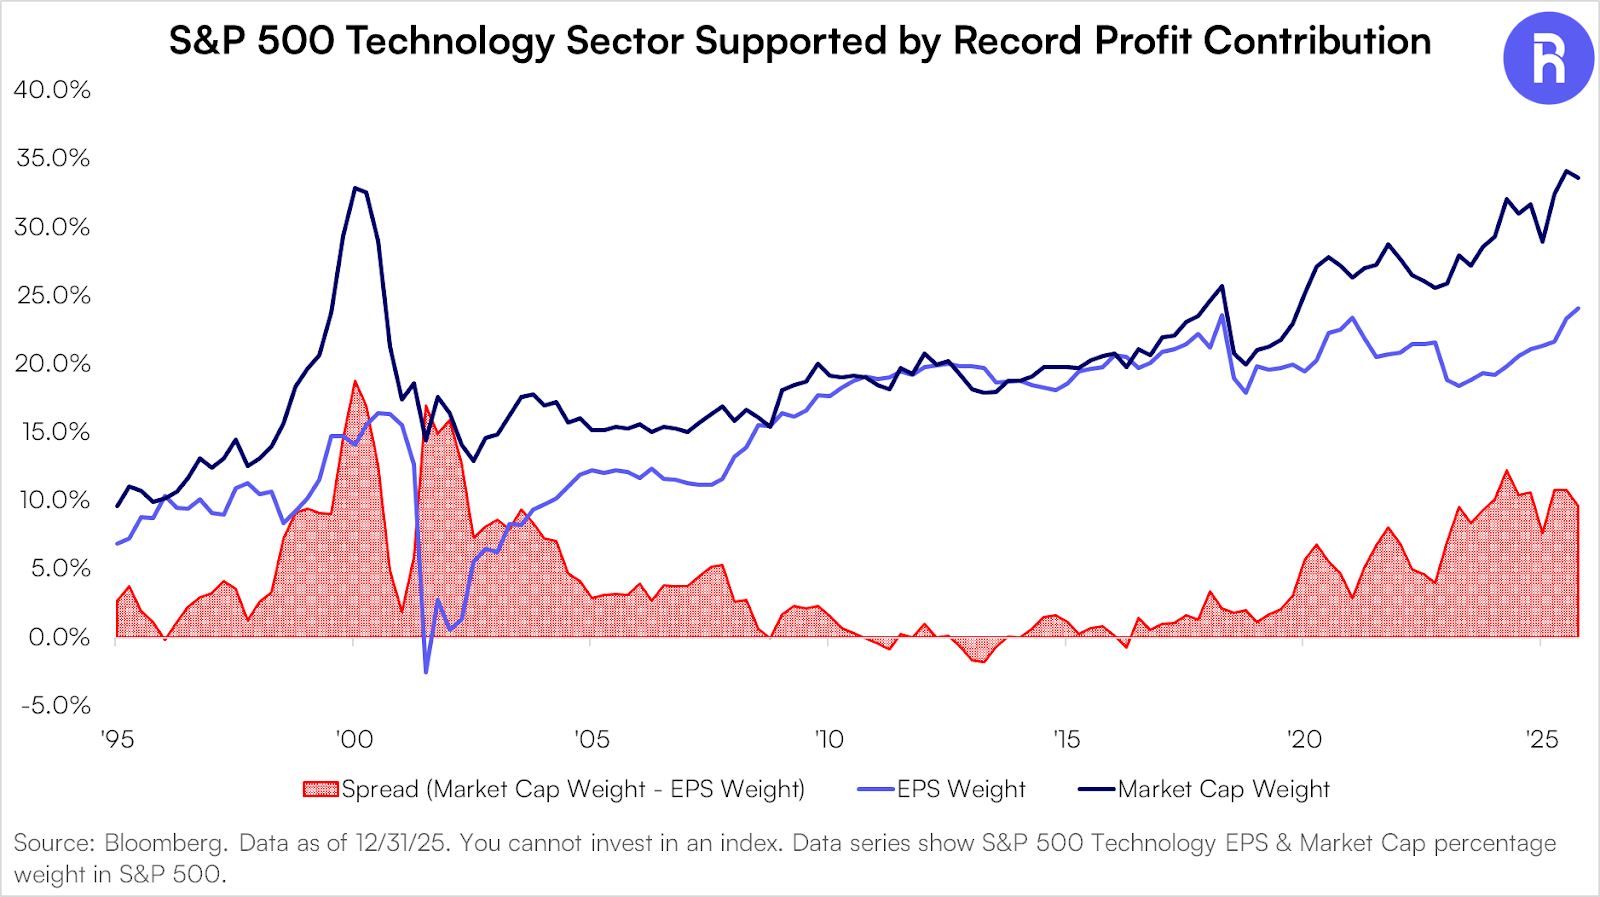
The dominant risk in productivity-driven cycles is underestimating the persistence of earnings power. The current cycle is supported by a stronger earnings contribution backdrop, which separates it from the speculative nature of the dotcom bubble.
Margin Expansion Paints Supportive Picture
Margin expansion has been a fundamental boon for generative AI stocks specifically and the Technology sector broadly. Currently, one year forward estimated margins for the S&P 500 Technology sector are at record levels, while the six month revisions in those estimates are comparable to changes last seen following the 2009 market low.
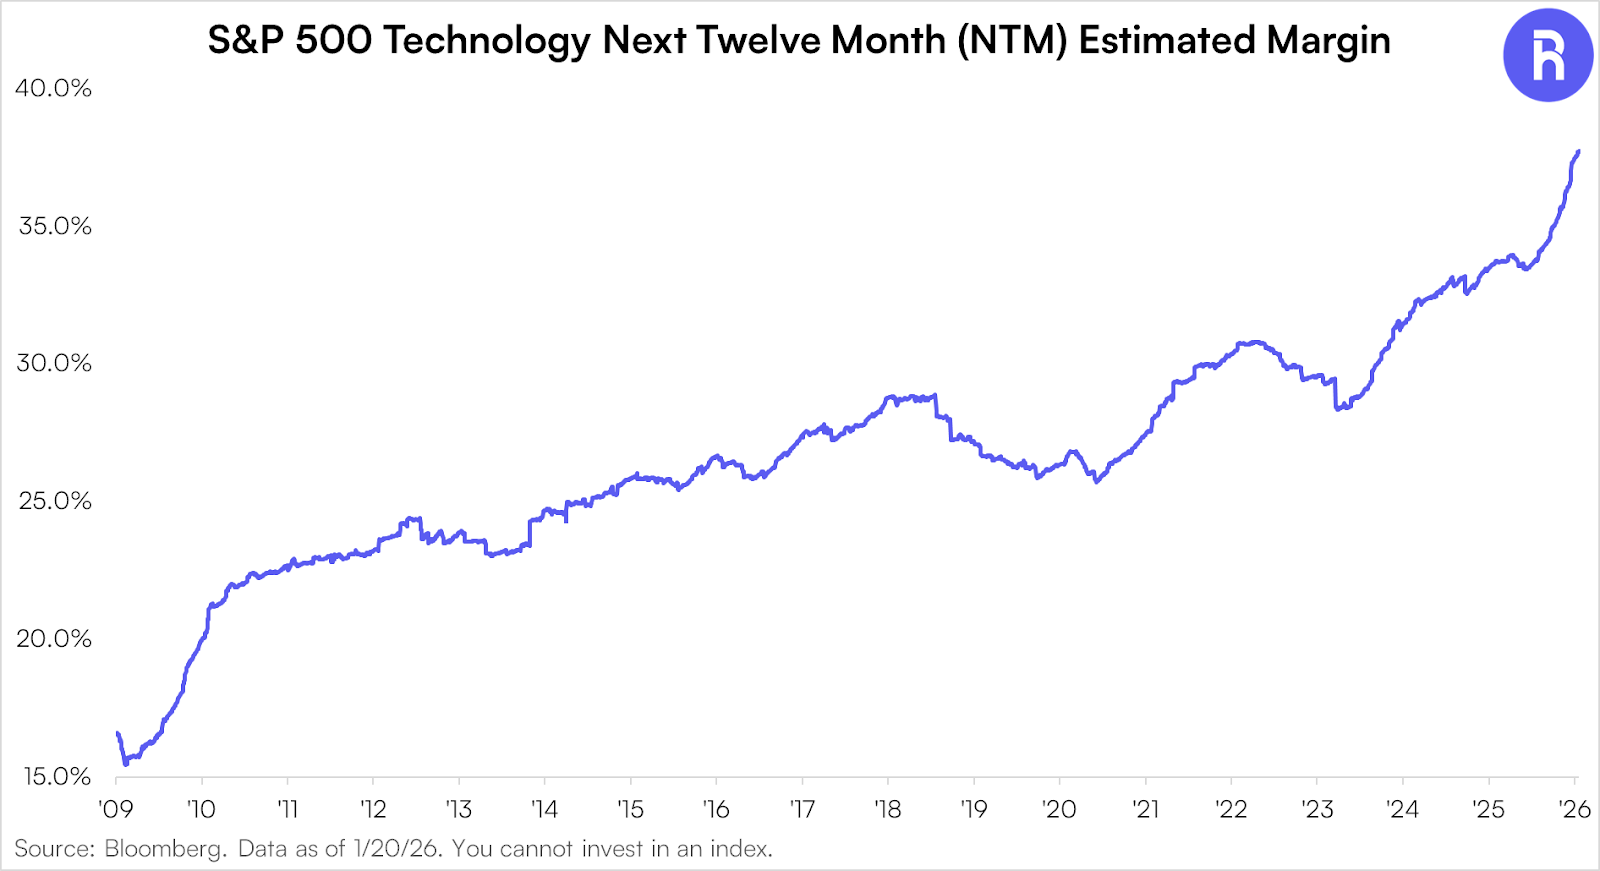
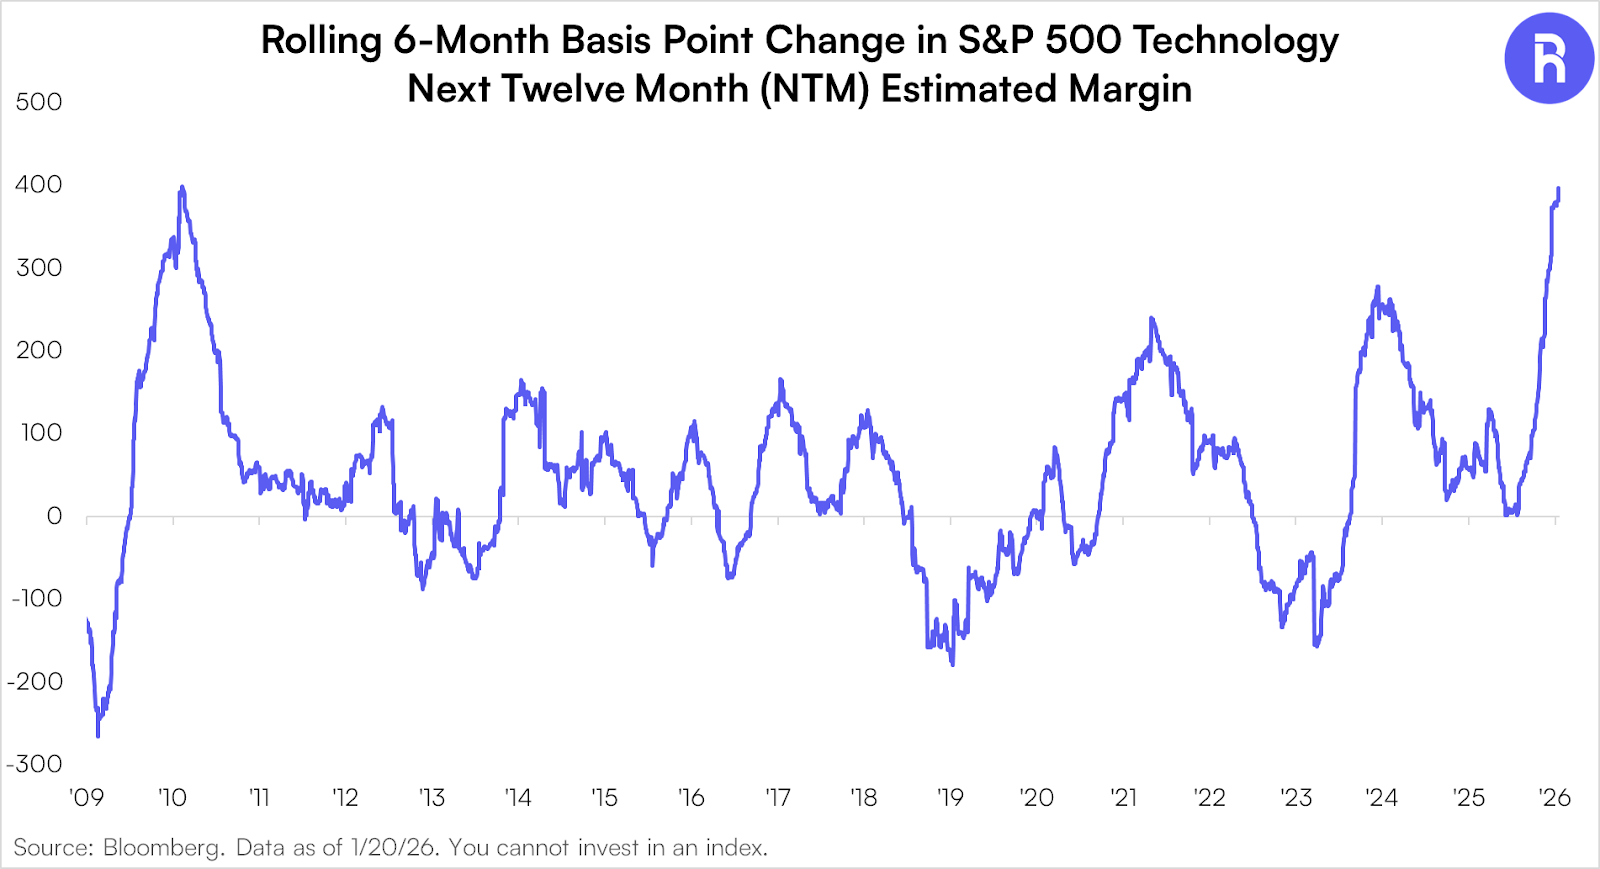
Equity price appreciation in AI stocks is being reinforced by improving earnings power margin expansion.
AI is Leading to Productivity Growth
The most understated aspect of the AI cycle is its impact on labor productivity. Unlike prior technology waves that primarily created new products or services, AI is directly improving worker efficiency across industries. The St. Louis Federal Reserve has documented these effects, showing that industries with higher AI adoption tend to experience faster labor productivity growth.* Additional data reinforce this trend, finding that workers who use generative AI save meaningful amounts of time on average.**
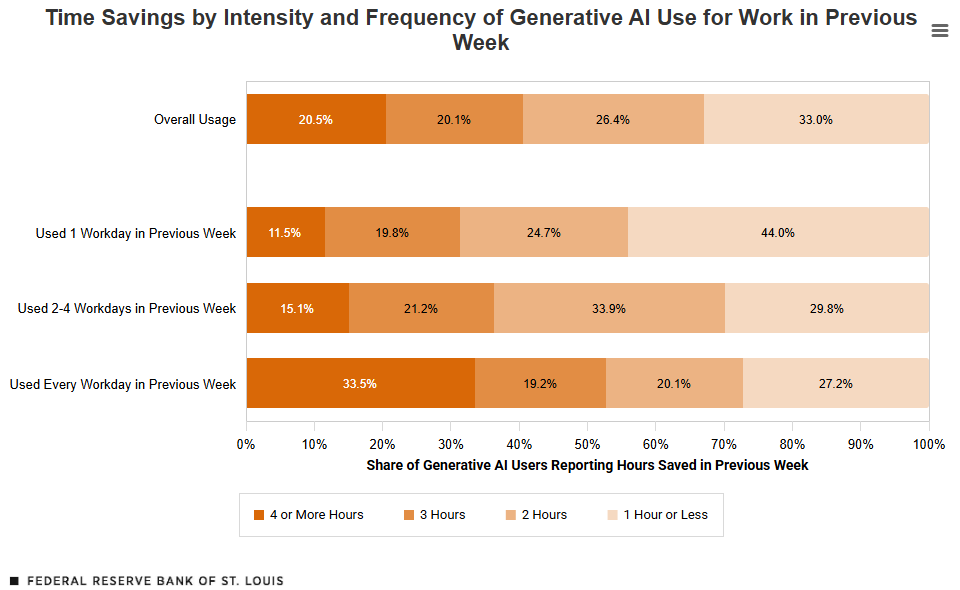
*https://www.stlouisfed.org/on-the-economy/2025/nov/state-generative-ai-adoption-2025
**https://www.stlouisfed.org/open-vault/2025/oct/generative-ai-productivity-future-work
AI implementation can be industry agnostic and can drive powerful productivity gains. creating a durable and self-reinforcing source of profit growth.
Is Multiple Expansion the Driver of AI Returns?
Breaking down the drivers of total return for the dotcom bubble and today’s bull market in generative AI paint a distinct picture. In the 1995 to 1999 period of the dotcom bubble, ~314% of the S&P 500 Technology sector’s 488% total return can be attributed to multiple expansion, with the remainder coming from earnings growth (171%) and dividends (3%).
In the four year period from the end of 2021 to year-end 2025, the S&P 500 Technology sector is up 92% on a total return basis, with 78% of the return coming from earnings growth, 5% from dividends, and 9% from multiple expansion. This is not to say that there are not frothier corners of the market, but to highlight that on the aggregate, the today’s extremes are well short of the dotcom era comparisons.
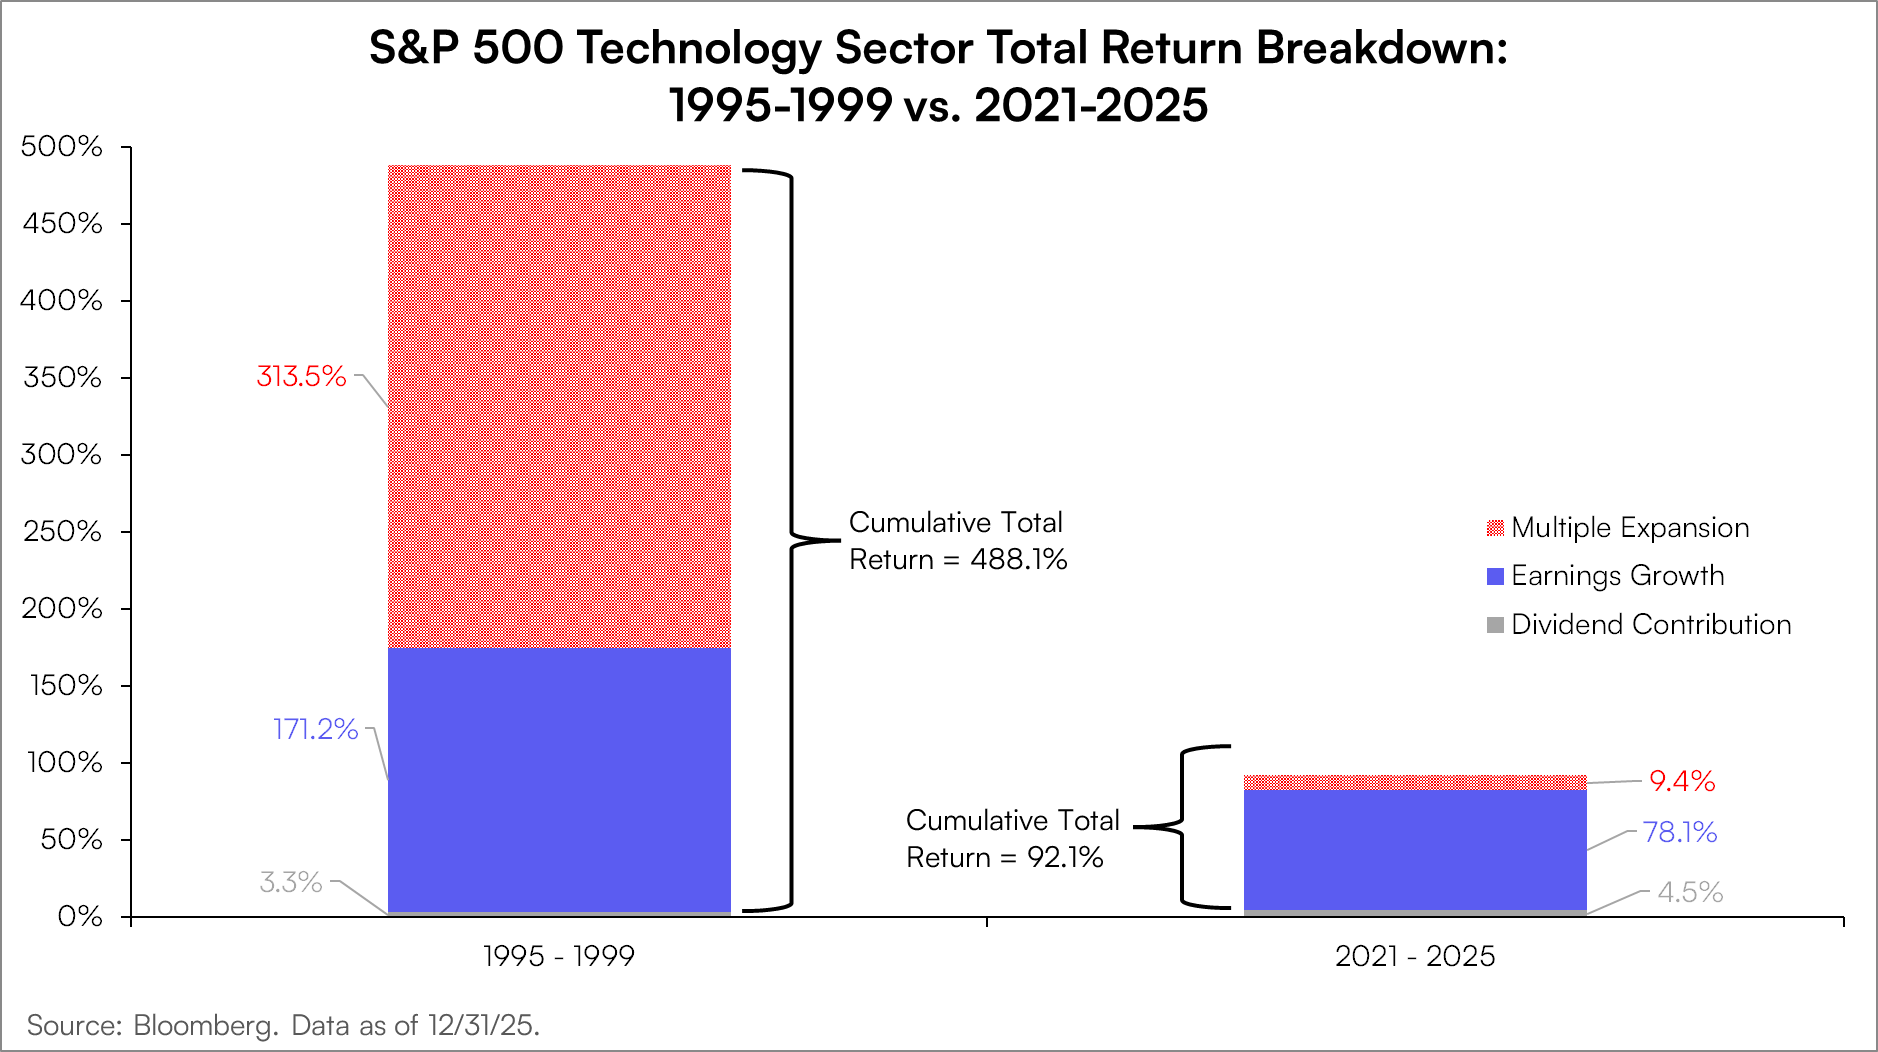
Elevated valuations are more plausibly explained by a structural increase in earnings power than by speculative excess.
Can Capex Drive Monetization?
The scale of AI-related capital expenditures has raised concerns about overinvestment and potential lack of monetization. From our vantage point, we see the billions of dollars of capex as a necessity for deploying compute infrastructure, automation, and power demand.
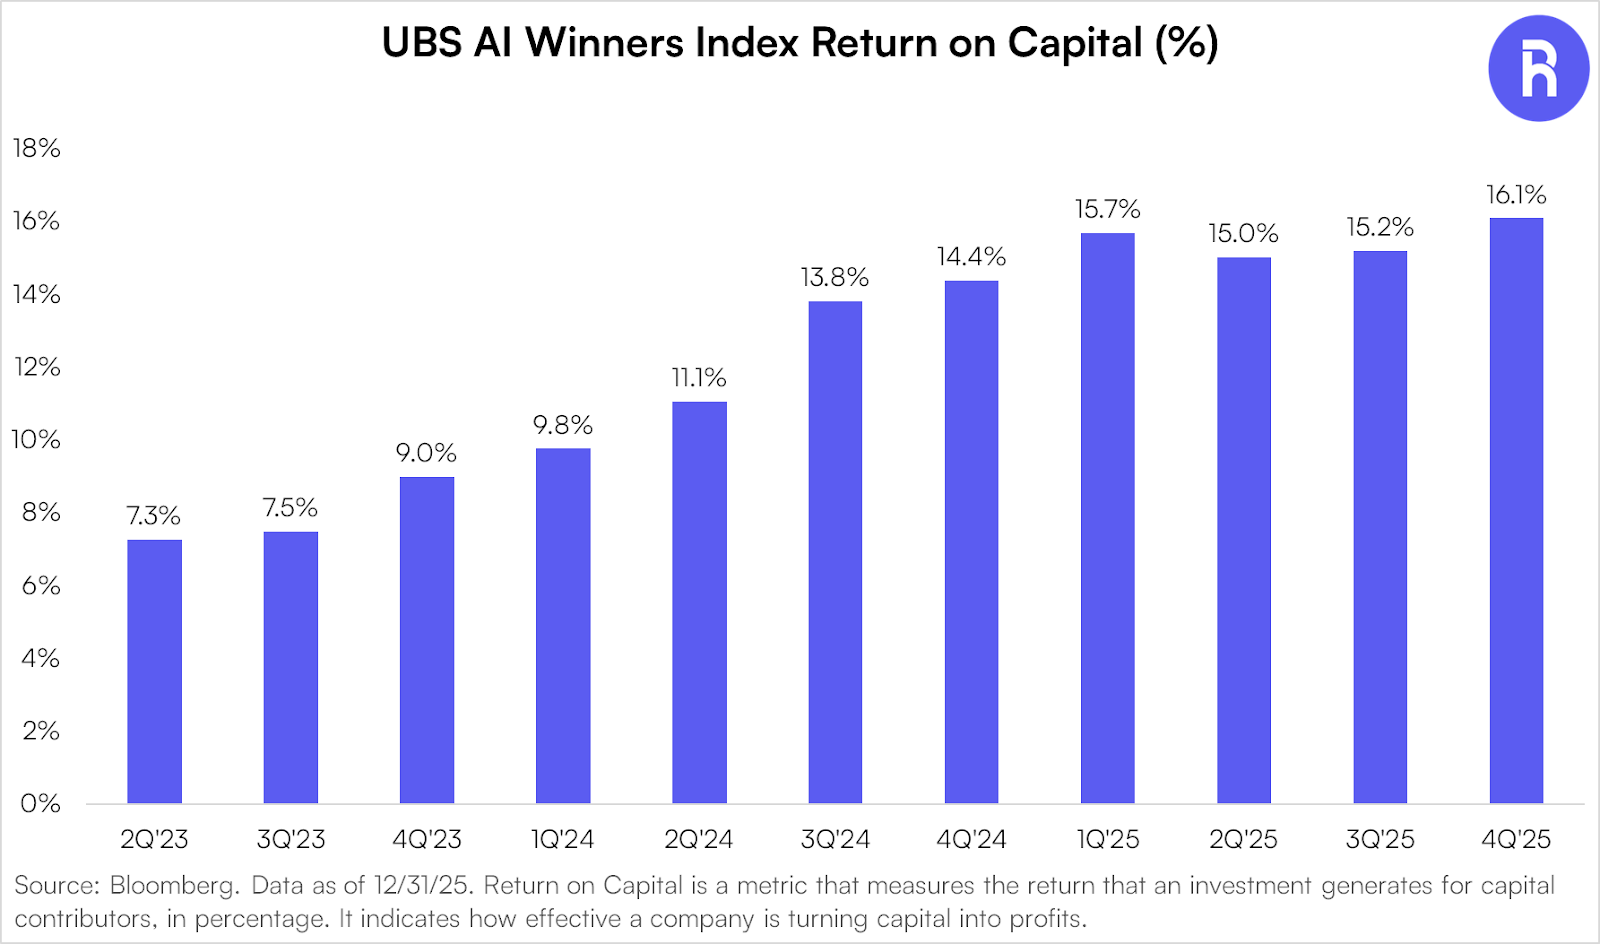
Importantly, returns on invested capital are already beginning to reflect these investments.
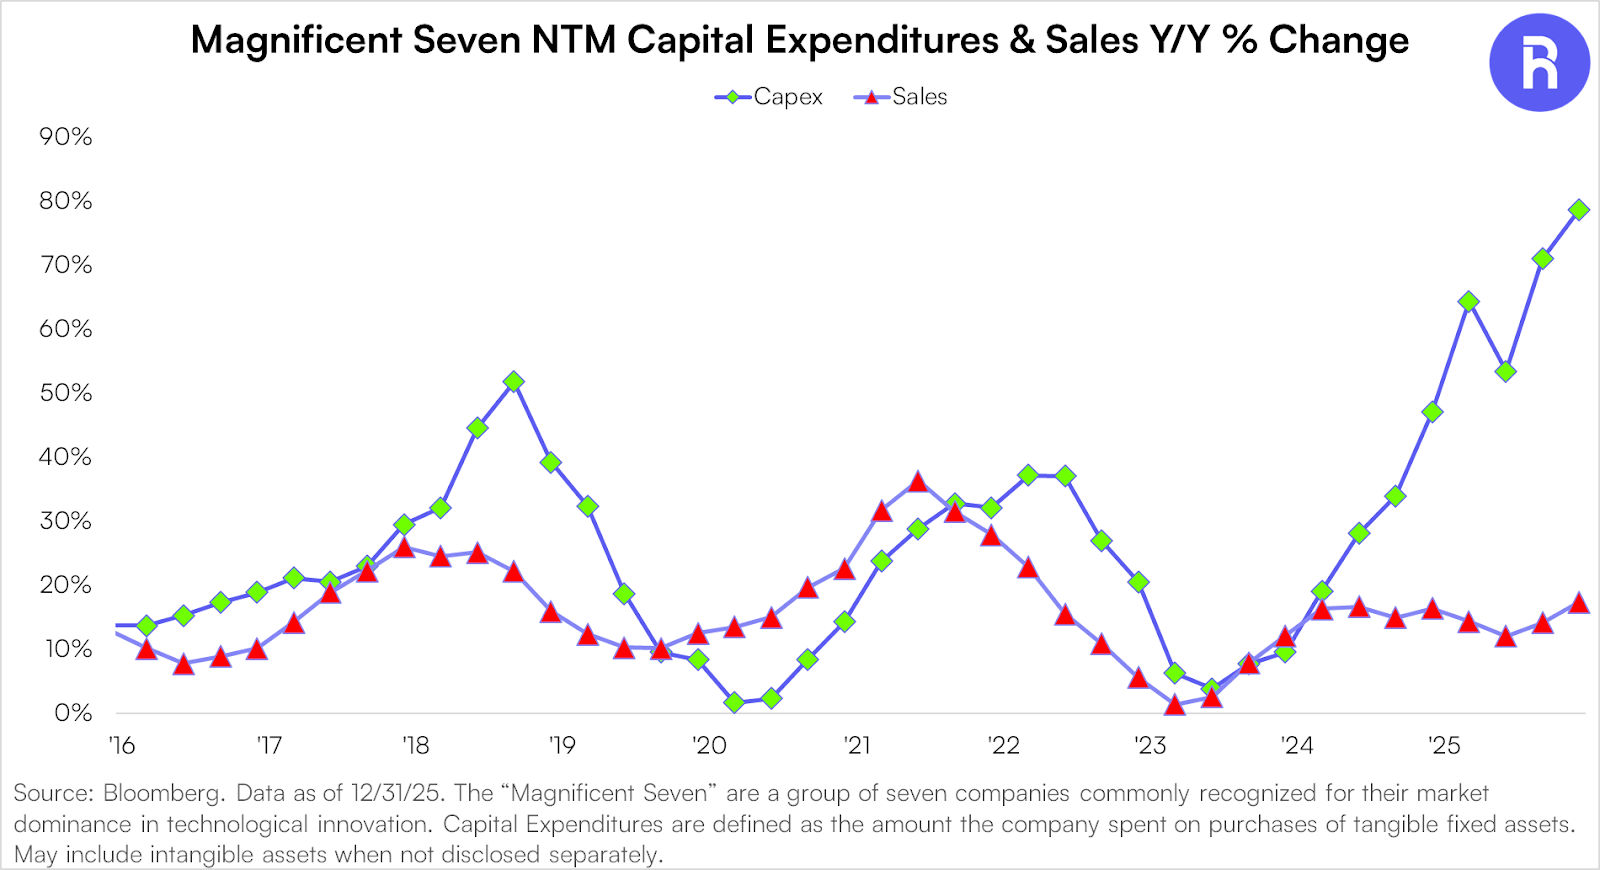
Capital expenditures in AI should be viewed as productive investment rather than speculative excess.
Gauging AI Stock Strength Going Forward
While concerns about an AI bubble are understandable, the data does not yet support that conclusion. AI is already showing measurable productivity gains, driving margin expansion and reshaping long-term earnings potential across large segments of the economy. While pockets of euphoria may emerge in individual AI stocks, broader price gains appear fundamentally supported, a key distinction from the dotcom era.
We would focus on whether fundamentals continue to confirm price advances. A more cautious stance becomes warranted only if earnings revisions deteriorate and growth slows, failing to validate higher valuations. Until then, elevated multiples alone do not signal a bubble; they reflect a structural re-rating driven by higher expected productivity and earnings growth.
Glossary
The UBS AI Winners Index tracks the performance of 45 US-listed stocks at the forefront of the Generative AI industry. Stocks selection is based on input from UBS research analysts, specialty sales, and transcripts/reports. The basket has been optimized for liquidity with initial weights capped at 5% and trades USD 2.5bn in a day at 20% ADV.
The S&P 500® is widely regarded as the best single gauge of large-cap U.S. equities and serves as the foundation for a wide range of investment products. The index includes 500 leading companies and captures approximately 80% coverage of available market capitalization.
The NASDAQ-100 Index is a modified capitalization-weighted index of the 100 largest and most active non-financial domestic and international issues listed on the NASDAQ. No security can have more than a 24% weighting. The index was developed with a base value of 125 as of February 1, 1985. Prior to December 21,1998 the Nasdaq 100 was a cap-weighted index.
The S&P 500® Information Technology comprises those companies included in the S&P 500 that are classified as members of the GICS® information technology sector.
The dotcom bubble, also known as the Internet bubble, epitomized a period of speculative mania that drove U.S. technology stock valuations sky-high during the late 1990s. Fueled by a fervor for Internet-based companies, equity markets experienced exponential growth, highlighted by the Nasdaq index skyrocketing from under 1,000 in 1995 to more than 5,000 by 2000. This speculation relied heavily on the promise of profitability rather than actual earnings, leading to a frenzy where investors overlooked traditional financial fundamentals.
Investors should consider the investment objectives, risk, charges and expenses carefully before investing. For a prospectus or summary prospectus with this and other information about Roundhill ETFs please call 1-855-561-5728 or visit the website at www.roundhillinvestments.com/etf/. Read the prospectus or summary prospectus carefully before investing.
Artificial Intelligence Company Risk. Companies involved in, or exposed to, artificial intelligence related businesses may have limited product lines, markets, financial resources or personnel. These companies face intense competition and potentially rapid product obsolescence, and many depend significantly on retaining and growing the consumer base of their respective products and services.
Technology Sector Risk. The Fund will invest substantially in companies in the information technology sector, and therefore the performance of the Fund could be negatively impacted by events affecting this sector. Market or economic factors impacting technology companies and companies that rely heavily on technological advances could have a significant effect on the value of the Fund’s investments. The value of stocks of information technology companies and companies that rely heavily on technology is particularly vulnerable to rapid changes in technology product cycles, rapid product obsolescence, government regulation and competition, both domestically and internationally, including competition from foreign competitors with lower production costs.
New Fund Risk. The Fund is a recently organized management investment company with no operating history. As a result, prospective investors do not have a track record or history on which to base their investment decisions. Small-Capitalization Investing. The securities of small-capitalization companies may be more vulnerable to adverse issuer, market, political, or economic developments than securities of large- or mid-capitalization companies. The securities of small capitalization companies generally trade in lower volumes and are subject to greater and more unpredictable price changes than large- or mid-capitalization stocks or the stock market as a whole.
Micro-Capitalization Investing. Micro-capitalization companies often have limited product lines, narrower markets for their goods and/or services and more limited managerial and financial resources than larger, more established companies, including companies which are considered small- or mid-capitalization.
Concentration Risk. The Fund will be concentrated in securities of issuers having their principal business activities in the technology group of industries. To the extent that the Fund concentrates in a group of industries, it will be subject to the risk that economic, political, or other conditions that have a negative effect on that group of industries will negatively impact them to a greater extent than if its assets were invested in a wider variety of industries.
CHAT is distributed by Foreside Fund Services, LLC.