Dividends in the Doghouse
A recent Bloomberg News article highlighted how flows into U.S.-listed dividend exchange-traded funds (ETFs) were weak in 2023.1 In fact, with inflows of only $1.64 billion the category experienced its weakest annual flows ever,2 solidly behind the 20-year average of $12.6 billion.
Flows into Dividend ETFs were Lackluster in 2023
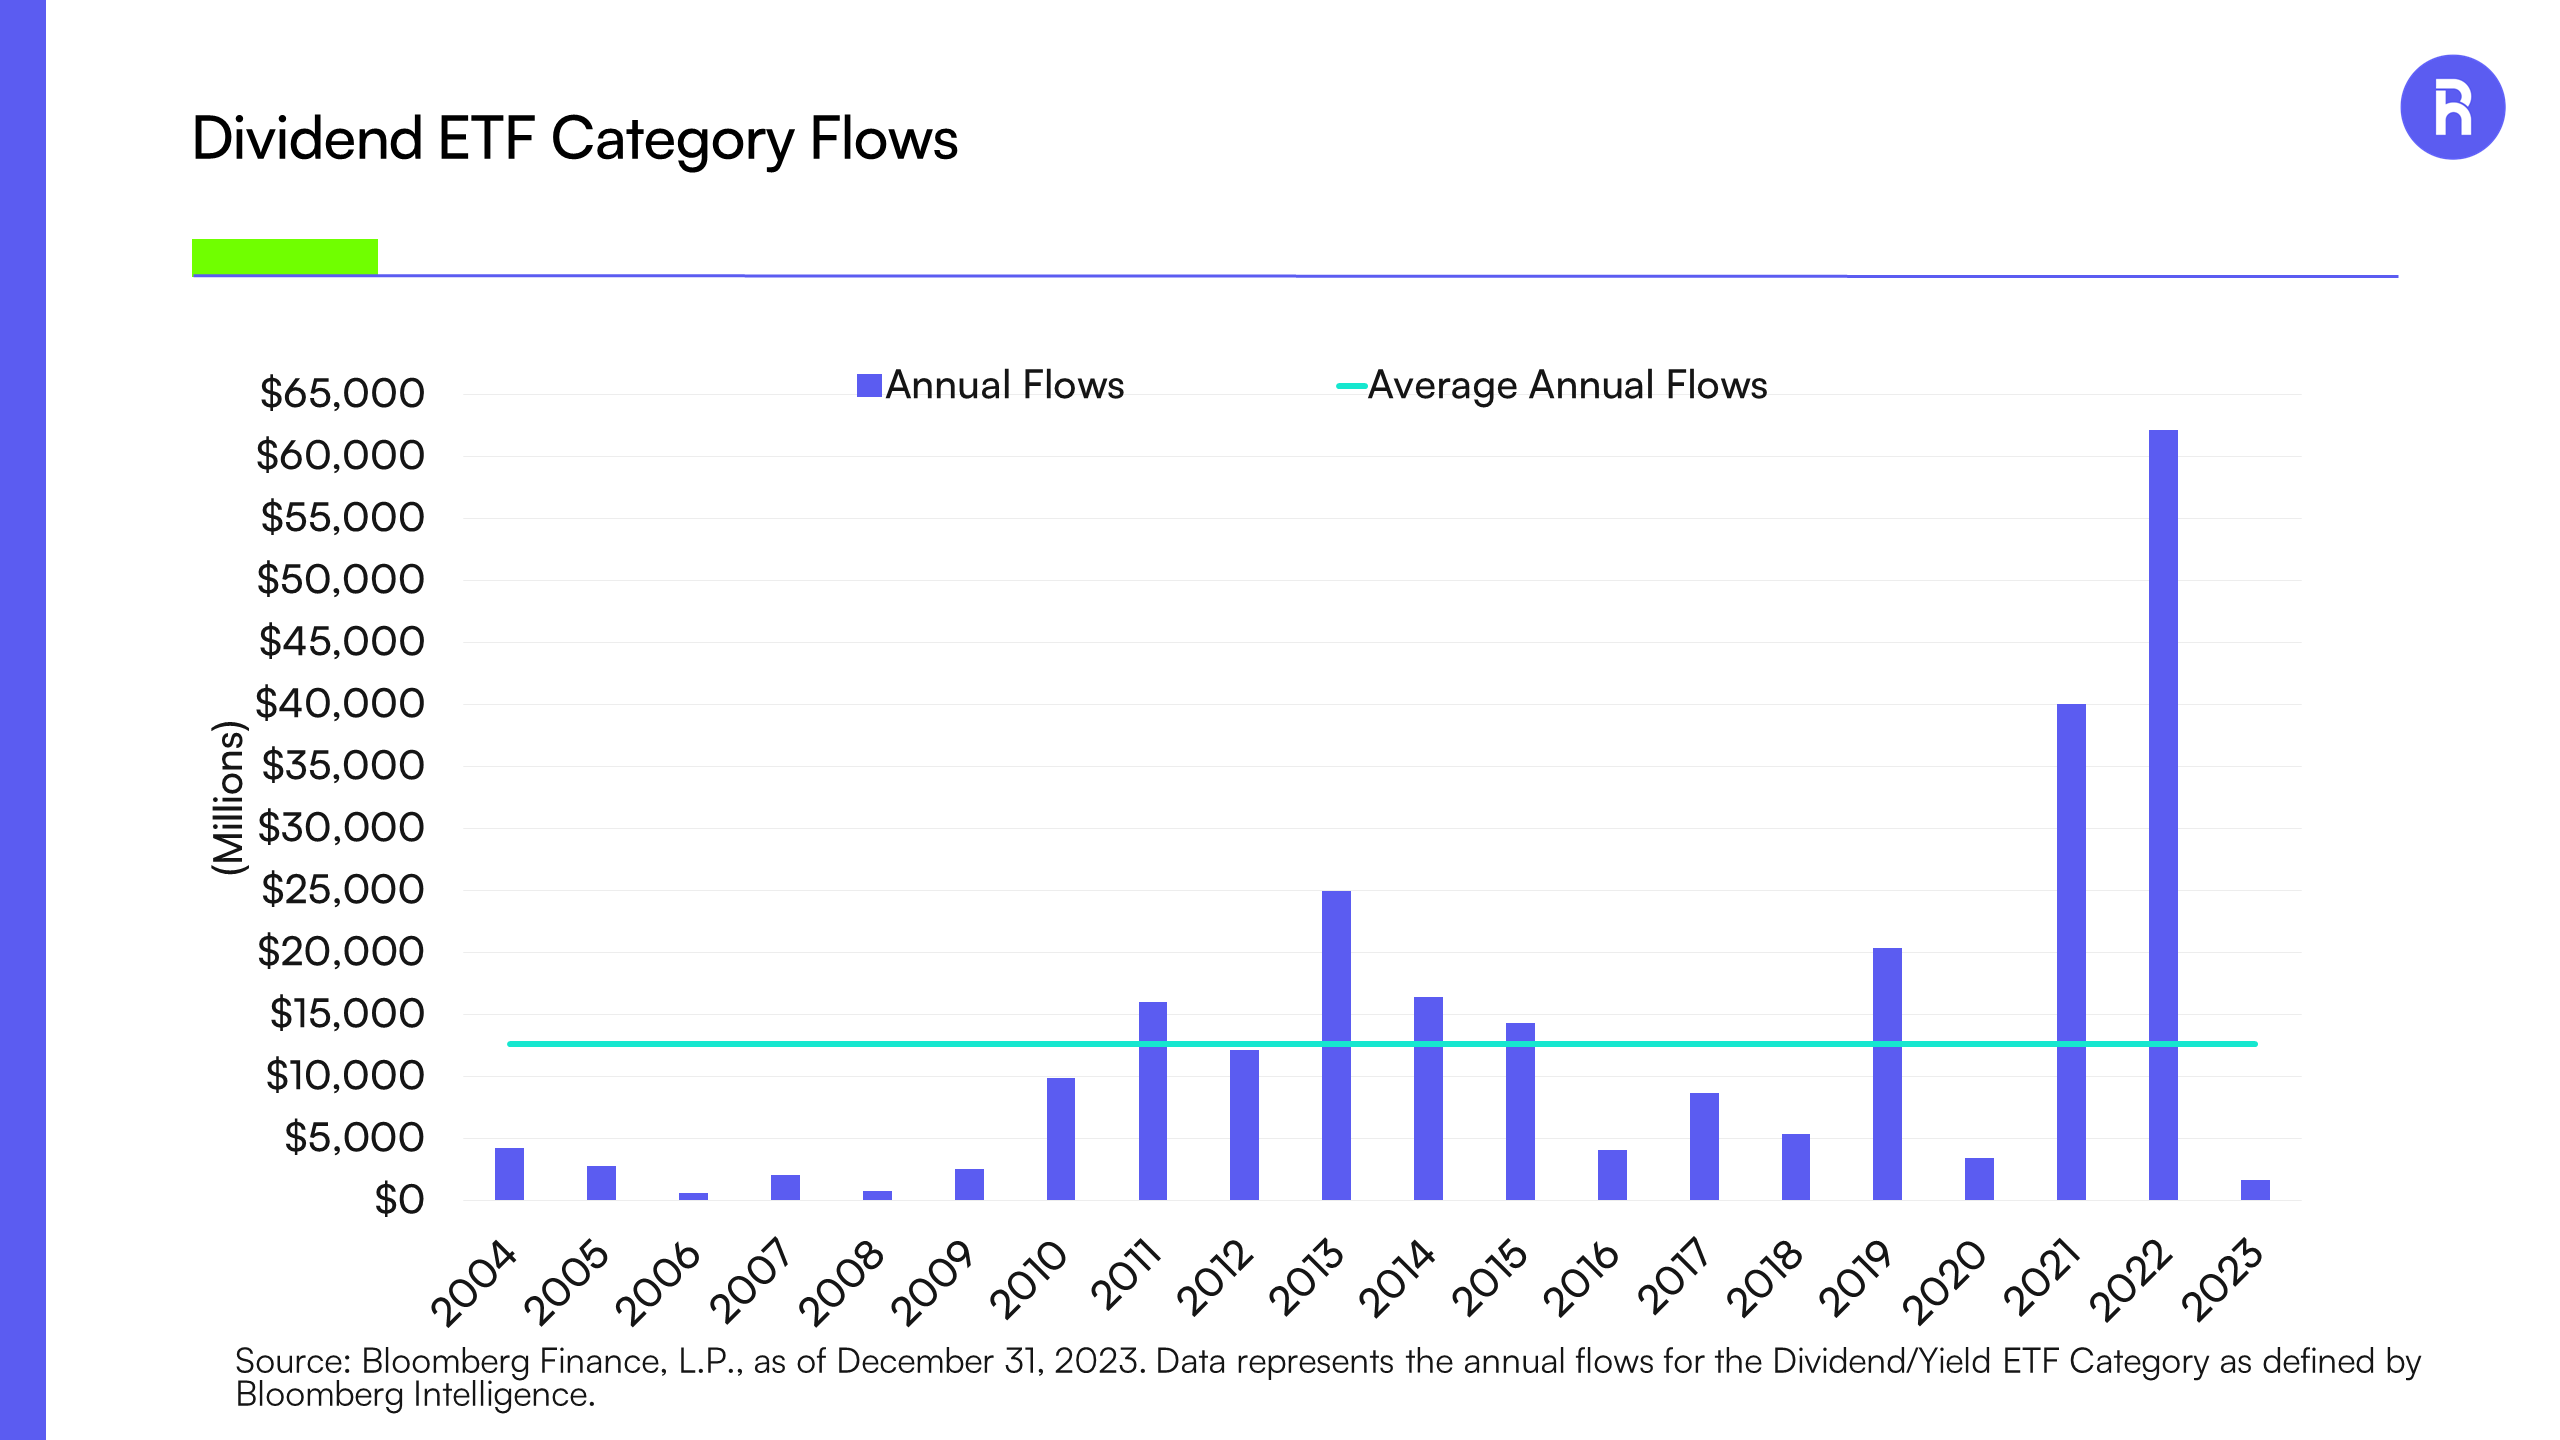
Source: Bloomberg Finance, L.P., as of December 31, 2023. Data represents the annual flows for the Dividend/Yield ETF Category as defined by Bloomberg Intelligence.
Why were flows into Dividend ETFs so modest last year?
On the one hand, investors loaded up on Dividend ETFs in 2021 and 2022, with combined flows in those years topping $100 billion. They may have felt full, especially as US T-Bills and other cash-like instruments offered compelling yield. On the other hand, performance may have had something to do with it.
While elite dividend growth companies have been incredibly resilient over long time periods, with average annual outperformance of over 2%, they performed poorly relative to the market in 2023. The S&P High Yield Dividend Aristocrats Index returned a modest 2.83% in 2023, underperforming the S&P 500 Index by 26.29%. This is the worst ever relative performance in the index’s history, dating back to 2000.
The main driver of the group’s 2023 underperformance was lack of exposure to the Magnificent Seven stocks, as not owning these names contributed nearly 40% of the underperformance alone. More broadly, underweights to the top performing Information Technology sector and overweights to the underperforming Utilities and Consumer Staples sectors, did not help either. In short, the weak relative performance may be logical in the context of an extremely narrow market led by a handful of mega cap tech giants. While past performance is not indicative of future results, some of the best years of outperformance for Dividend Growers came in 2000, 2001, 2002, 2008, and 2022, all of which were challenging years for the broader market.
Dividend Aristocrats Underperformed in 2023
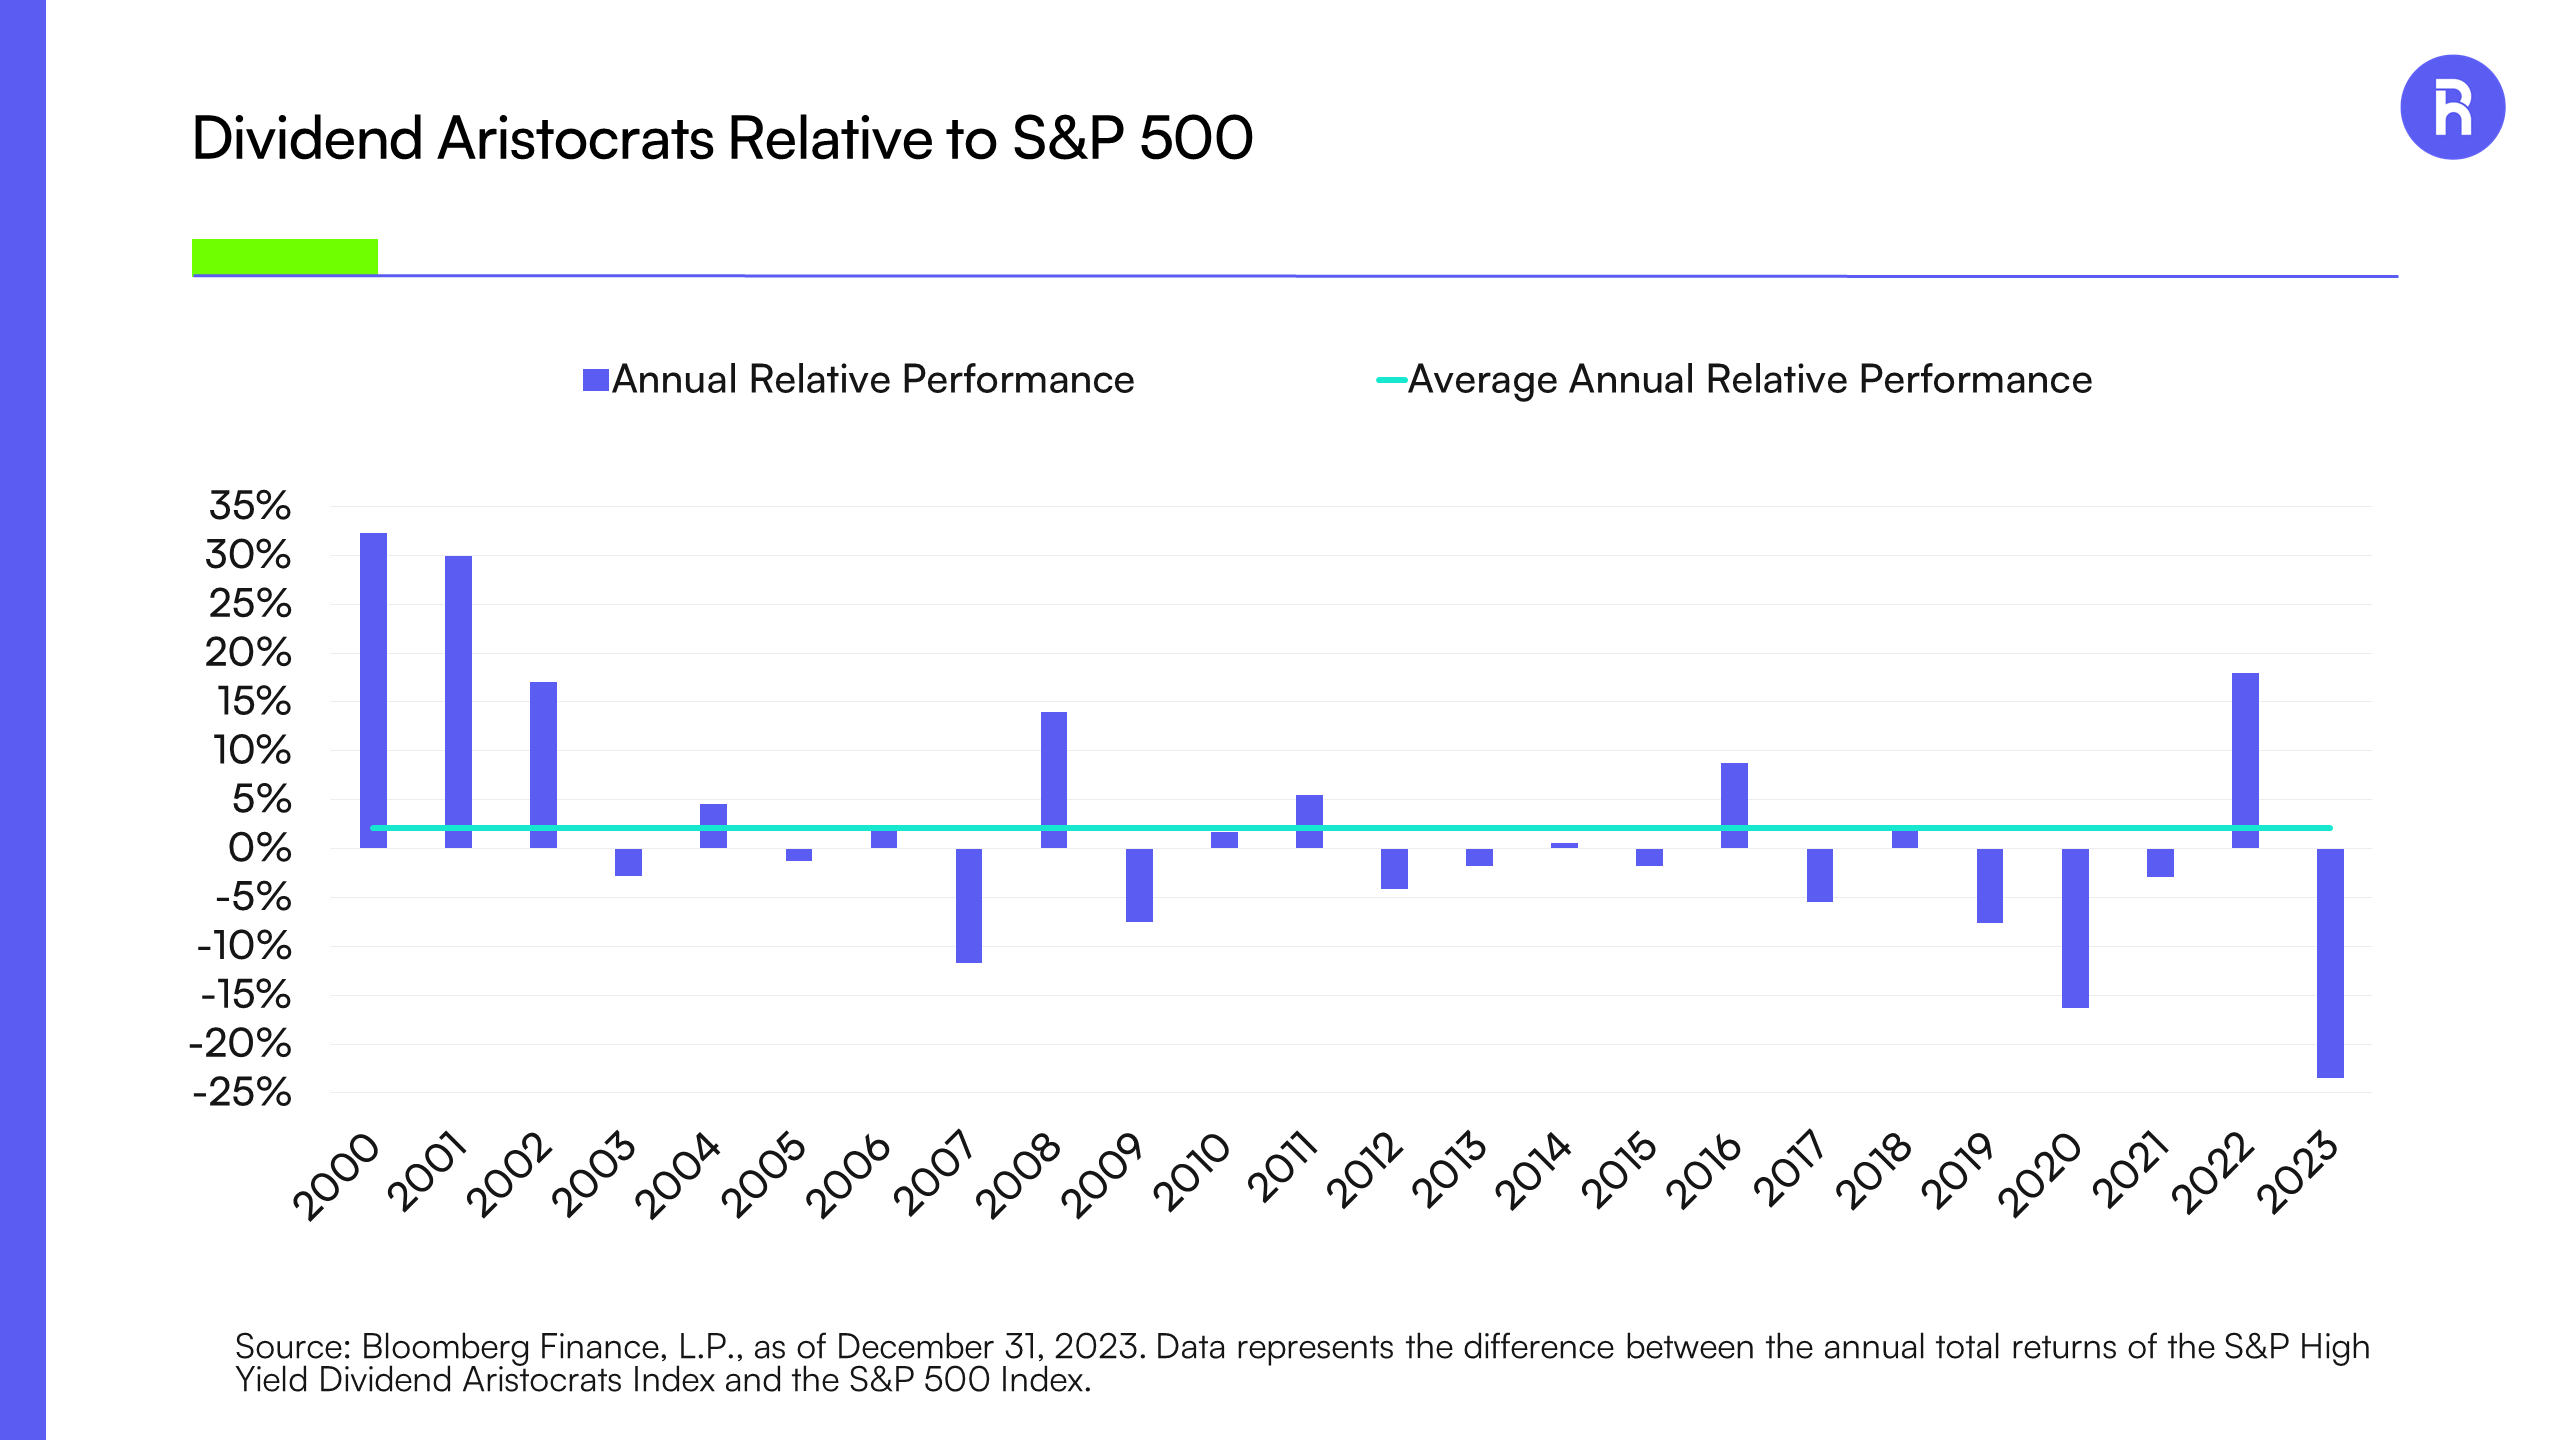
Source: Bloomberg Finance, L.P., as of December 31, 2023. Data represents the difference between the annual total returns of the S&P High Yield Dividend Aristocrats Index and the S&P 500 Index. Past performance is no guarantee of future results. Not intended as a recommendation to buy or sell any securities mentioned herein, to adopt any investment strategy, or as any call to action. Index performance is not representative of fund performance. It is not possible to invest directly in an index. Please see important disclosures at the end of this commentary regarding hypothetical performance.
After the significant underperformance in 2023, is there an opportunity for dividend stocks in 2024?
Yes. Let’s look at valuations.
Historically, the Price-to-Earnings (P/E) ratio of Dividend Aristocrats is lower than the S&P 500, indicating they are often valued less expensively, consistent with companies that offer relatively stable income. However, the relative valuation shows that the Dividend Aristocrats were valued more expensively than the S&P 500 for a multi-year prior to the COVD-19 pandemic. At the end of 2023, the Aristocrats were trading at inexpensive valuations compared to the market. Specifically, the Aristocrats closed the year at a P/E ratio of 18.15x (versus the S&P 500 at 22.13x), which is inline with its average P/E over the last 10 years. One way to interpret this is that investors valued stability more than growth prior to the pandemic.
Dividend Aristocrats are Trading at Attractive Valuations
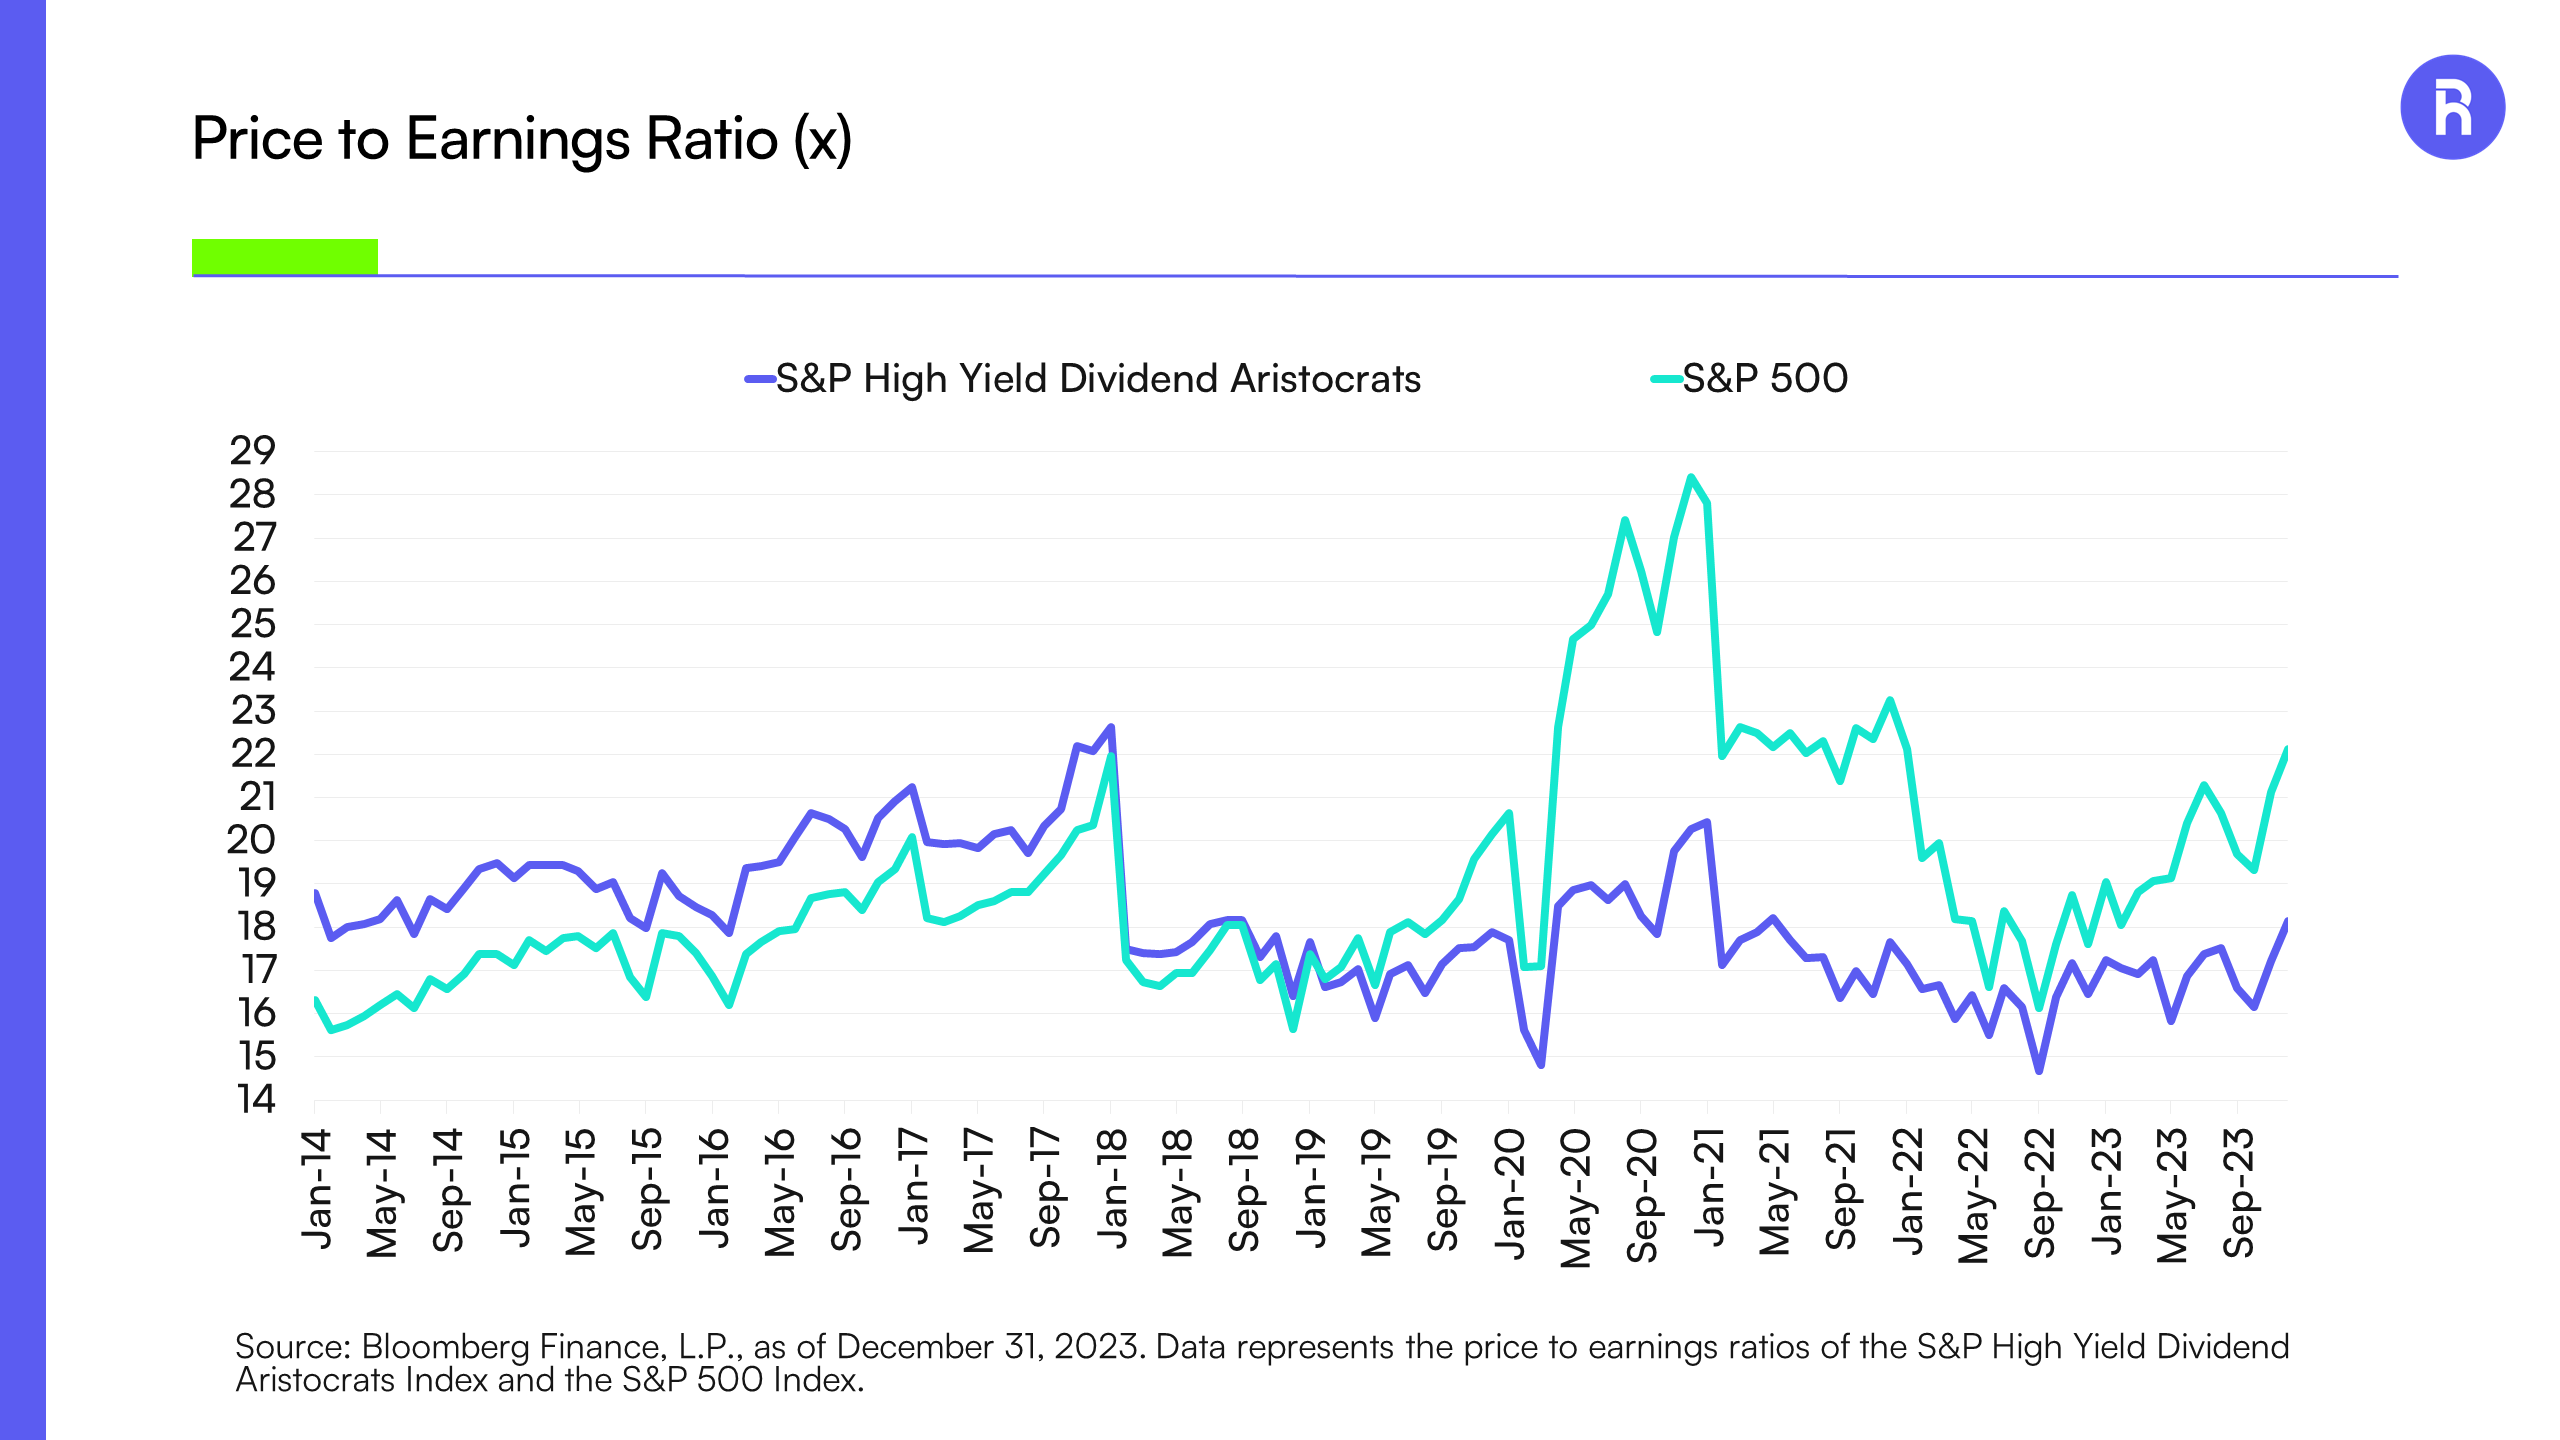
Source: Bloomberg Finance, L.P., as of December 31, 2023. Data represents the price to earnings ratios of the S&P High Yield Dividend Aristocrats Index and the S&P 500 Index. Past performance is no guarantee of future results. Not intended as a recommendation to buy or sell any securities mentioned herein, to adopt any investment strategy, or as any call to action. Index performance is not representative of fund performance. It is not possible to invest directly in an index. Please see important disclosures at the end of this commentary regarding hypothetical performance.
Investors looking to add exposure to high quality, resilient companies may want to look beyond the Dividend Aristocrats and to the Dividend Monarchs, a group of companies which have an even more exclusive 50+ years of consecutive dividend increases.
Comparatively, the Dividend Monarchs, with a higher dividend yield and a lower payout ratio potentially offer a better balance between offering an attractive yield and retaining earnings. Their higher return on equity (ROE) may indicate more efficient use of equity, while the P/E ratios of the two groups are similar, suggesting comparable market valuations.
Dividend Monarchs Potentially Offer Higher Yield with Lower Payout Ratios
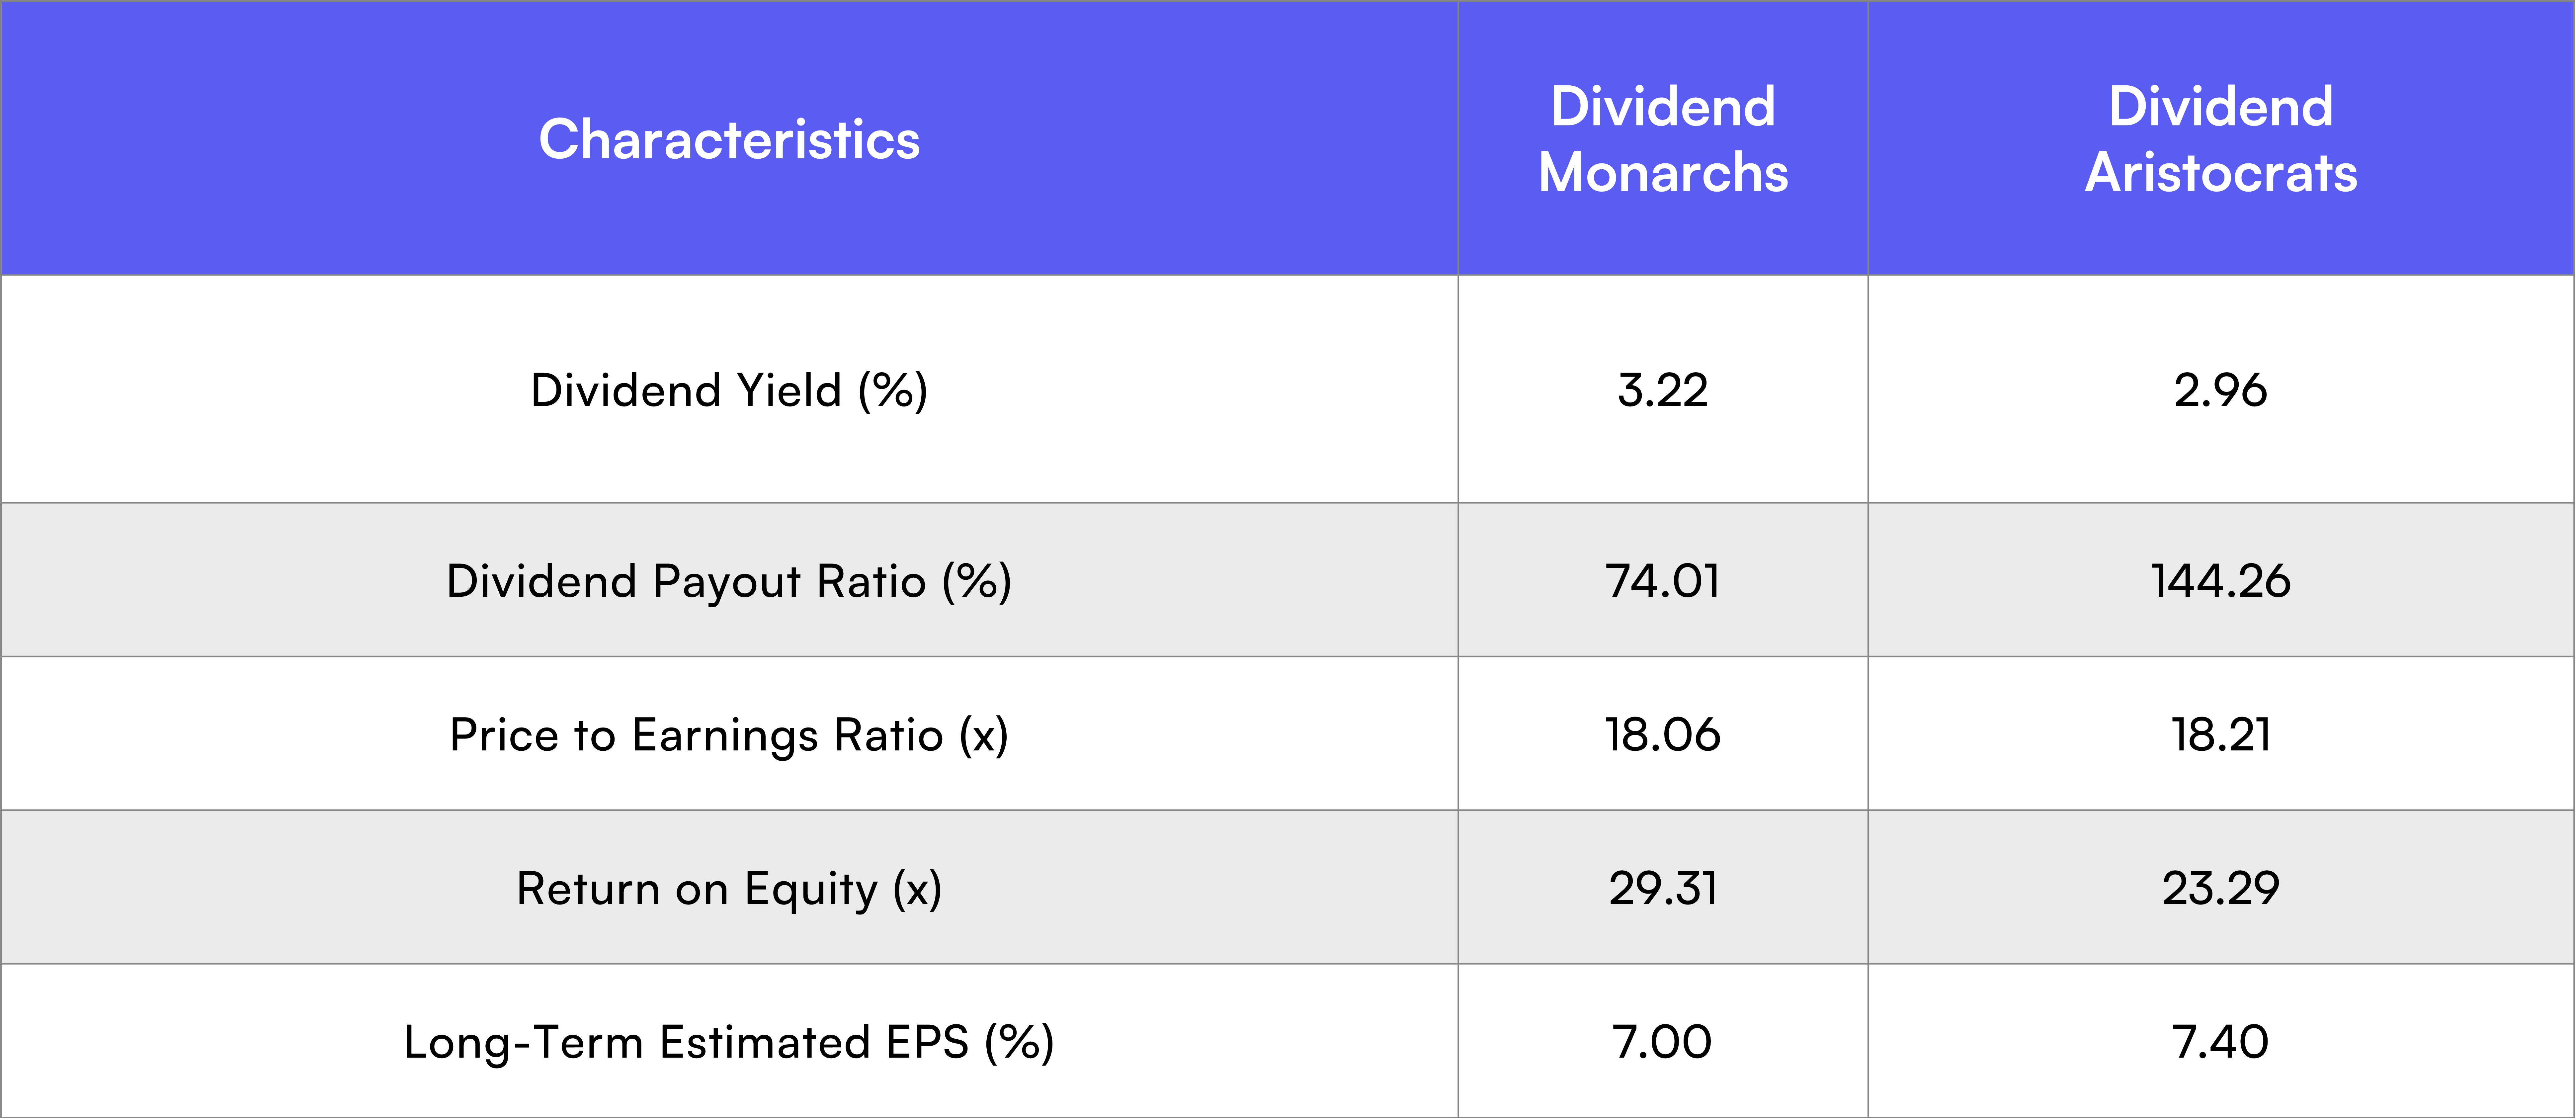
Source: Bloomberg Finance, L.P., as of December 31, 2023. Data represents the price to earnings ratios of the S&P High Yield Dividend Aristocrats Index and the S&P 500 Index.
Investors may look to capitalize on these attractive valuations and consider Dividend Monarchs for potentially more stable, value-oriented investments during times of high valuation for the broader market.
Forecasts are inherently limited and should not be relied upon when making investment decisions. There is no guarantee projected growth will occur.
1 https://www.bloomberg.com/news/articles/2023-12-22/wall-street-diversification-trades-get-crushed-as-s-p-500-soars
2 Source: Bloomberg Intelligence, as of December 31, 2023.
Glossary
S&P Dividend Monarchs Index: The S&P Dividend Monarchs Index measures the performance of companies that have followed a policy of consistently increasing dividends every year for at least 50 years. Only securities issued by companies that have increased their total dividend per share amount every year for at least 50 consecutive years are eligible for inclusion in the Index. The S&P Dividend Monarchs Index inception date is 4/23/2023.
S&P 500 Index (S&P 500®): The S&P 500® is widely regarded as the best single gauge of large-cap U.S. equities. The index includes 500 leading companies and covers approximately 80% of available market capitalization. The S&P 500 Index inception date is 3/4/1957.
S&P High Yield Dividend Aristocrats Index: The S&P High Yield Dividend Aristocrats index is designed to measure the performance of the 50 highest dividend yielding S&P Composite 1500 constituents which have followed a managed dividends policy of consistently increasing dividends every year for at least 20 years. The S&P High Yield Dividend Aristocrats Index inception date is 11/9/2005.
Risk Considerations
This document does not constitute advice or a recommendation or offer to sell or a solicitation to deal in any security or financial product. It is provided for information purposes only and on the understanding that the recipient has sufficient knowledge and experience to be able to understand and make their own evaluation of the proposals and services described herein, any risks associated therewith and any related legal, tax, accounting or other material considerations. To the extent that the reader has any questions regarding the applicability of any specific issue discussed above to their specific portfolio or situation, prospective investors are encouraged to contact Roundhill Investments or consult with the professional advisor of their choosing.
Investing involves risk, including possible loss of principal. Investing in dividend-paying stocks involves the risk that such stocks may fall out of favor with investors and underperform the broader market. Companies that issue dividend-paying stocks are not required to pay or continue paying dividends on such stocks. It is possible that issuers of the stocks will not declare dividends in the future or will reduce or eliminate the payment of dividends (including reducing or eliminating anticipated accelerations or increases in the payment of dividends) in the future. Investments made in small and mid-capitalization companies may be more volatile and less liquid due to limited resources or product lines and more sensitive to economic factors. Foreign investing involves social and political instability, market illiquidity, exchange-rate fluctuation, high volatility and limited regulation risks. Emerging markets may be more volatile and less liquid than more developed markets and therefore may involve greater risks. Depository Receipts involve risks similar to those associated investments in foreign securities, but may not provide a return that corresponds precisely with that of the underlying shares. Please see the prospectus for details of these and other risks.
The S&P Dividend Monarchs Index is a product of S&P Dow Jones Indices LLC or its affiliates (“S&P DJI”) and has been licensed for use by Roundhill Investments Inc. S&P®, S&P 500®, Dividend Aristocrats® and Dividend Monarchs™ are trademarks of Standard & Poor’s Financial Services LLC (“S&P”); Dow Jones® is a registered trademark of Dow Jones Trademark Holdings LLC (“Dow Jones”) and has been licensed for use by S&P Dow Jones Indices; and these trademarks have been licensed for use by S&P DJI and sublicensed for certain purposes by Roundhill Investments Inc.


