.png?width=80&height=80&name=RH_Symbol-PrimaryBllue%20(2).png)
With ChatGPT becoming part of the average person’s daily lexicon and Nvidia’s 24% return the day after its blowout earnings on May 24, 2023, many are asking — are generative artificial intelligence1 (generative AI or GAI) stocks already in a bubble?
We believe that, although valuations of certain AI stocks may not be inexpensive, these companies have relatively strong fundamentals and that sentiment has not reached a fever pitch. While there is no cut and dry approach to defining a bubble, there are some commonalities of bubbles throughout history that we test for generative AI:
Let’s review these points in detail.
Market Narratives
What’s a bubble? Although there are no specific quantitative thresholds to define a bubble, Gartner defines a financial bubble as a cycle “characterized by rapidly increasing prices of an asset to a point that is unsustainable, causing the asset to burst or contract in value.”
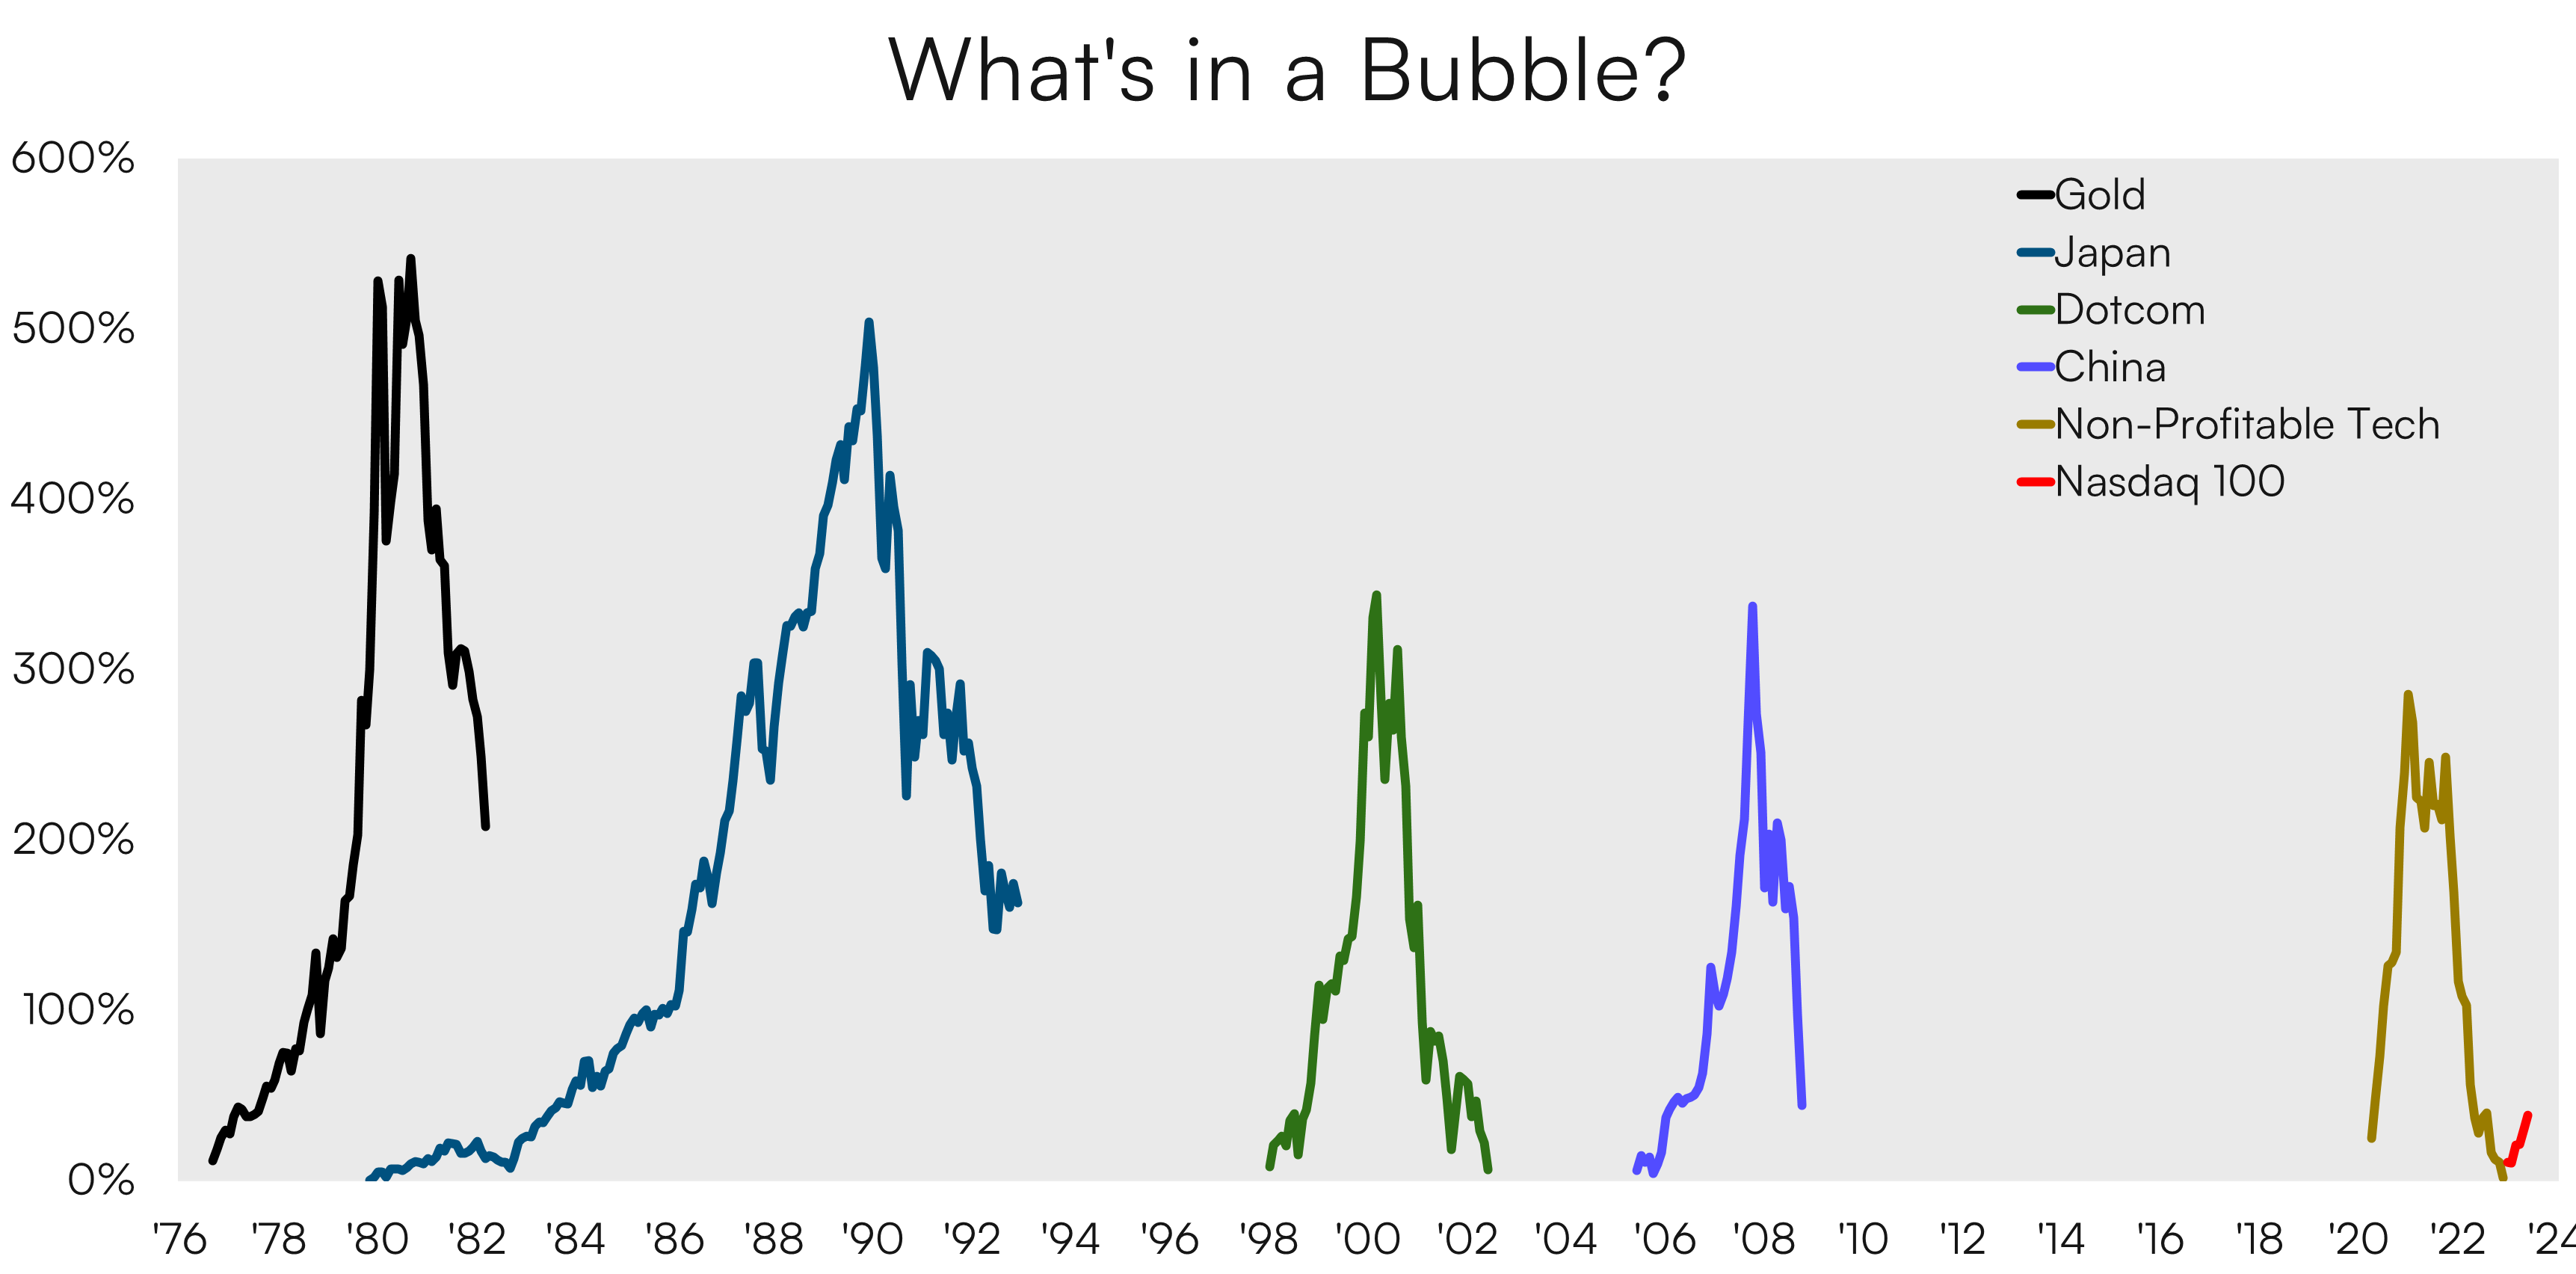
A leading narrative in today’s market suggests that generative AI is in a bubble, reminiscent of the dotcom era. Before we jump into the data that we believe helps to debunk this theory, let’s assess what happened during some of the bubbles of the last 50 years. The following chart demonstrates the percentage increases in select assets or indices that we believe reflected bubble territory:
Source: Bloomberg, as of July 3, 2023
Note: Gold represents gold commodity spot price; Japan is represented by the Nikkei 225 Index5; the Dotcom Bubble is represented by the Nasdaq 100 Index3; China is represented by the Hang Seng China Enterprises Index6; Non-Profitable Tech is represented by the Goldman Sachs Non-Profitable Tech Basket7
Note: Indexes are not managed, and one cannot invest directly into an index. Past performance is not a guarantee of future results.
Whether it be gold in the late 70’s, the Nikkei 225 Index of Japanese companies in the 80’s and 90’s, the dotcom bubble in the late 90’s into the 2000’s, the bubble in Chinese equities in the late 2000’s or non-profitable tech companies in the 2020’s, we can see that all these assets saw rapid, sharp share price appreciation of more than 300% trough-to-peak before many of the gains were eventually wiped out.
As shown in the above figure, the returns of the Nasdaq 100 Index have started 2023 strong, but we believe it has a long way to go before getting anywhere close to the returns of financial bubbles. So while we may be hearing increased chatter about generative AI, there is not sufficient evidence to suggest the narrative has reached a fever pitch, at least relative to past episodes.
Bubble Check: No ❌
Irrational Exuberance
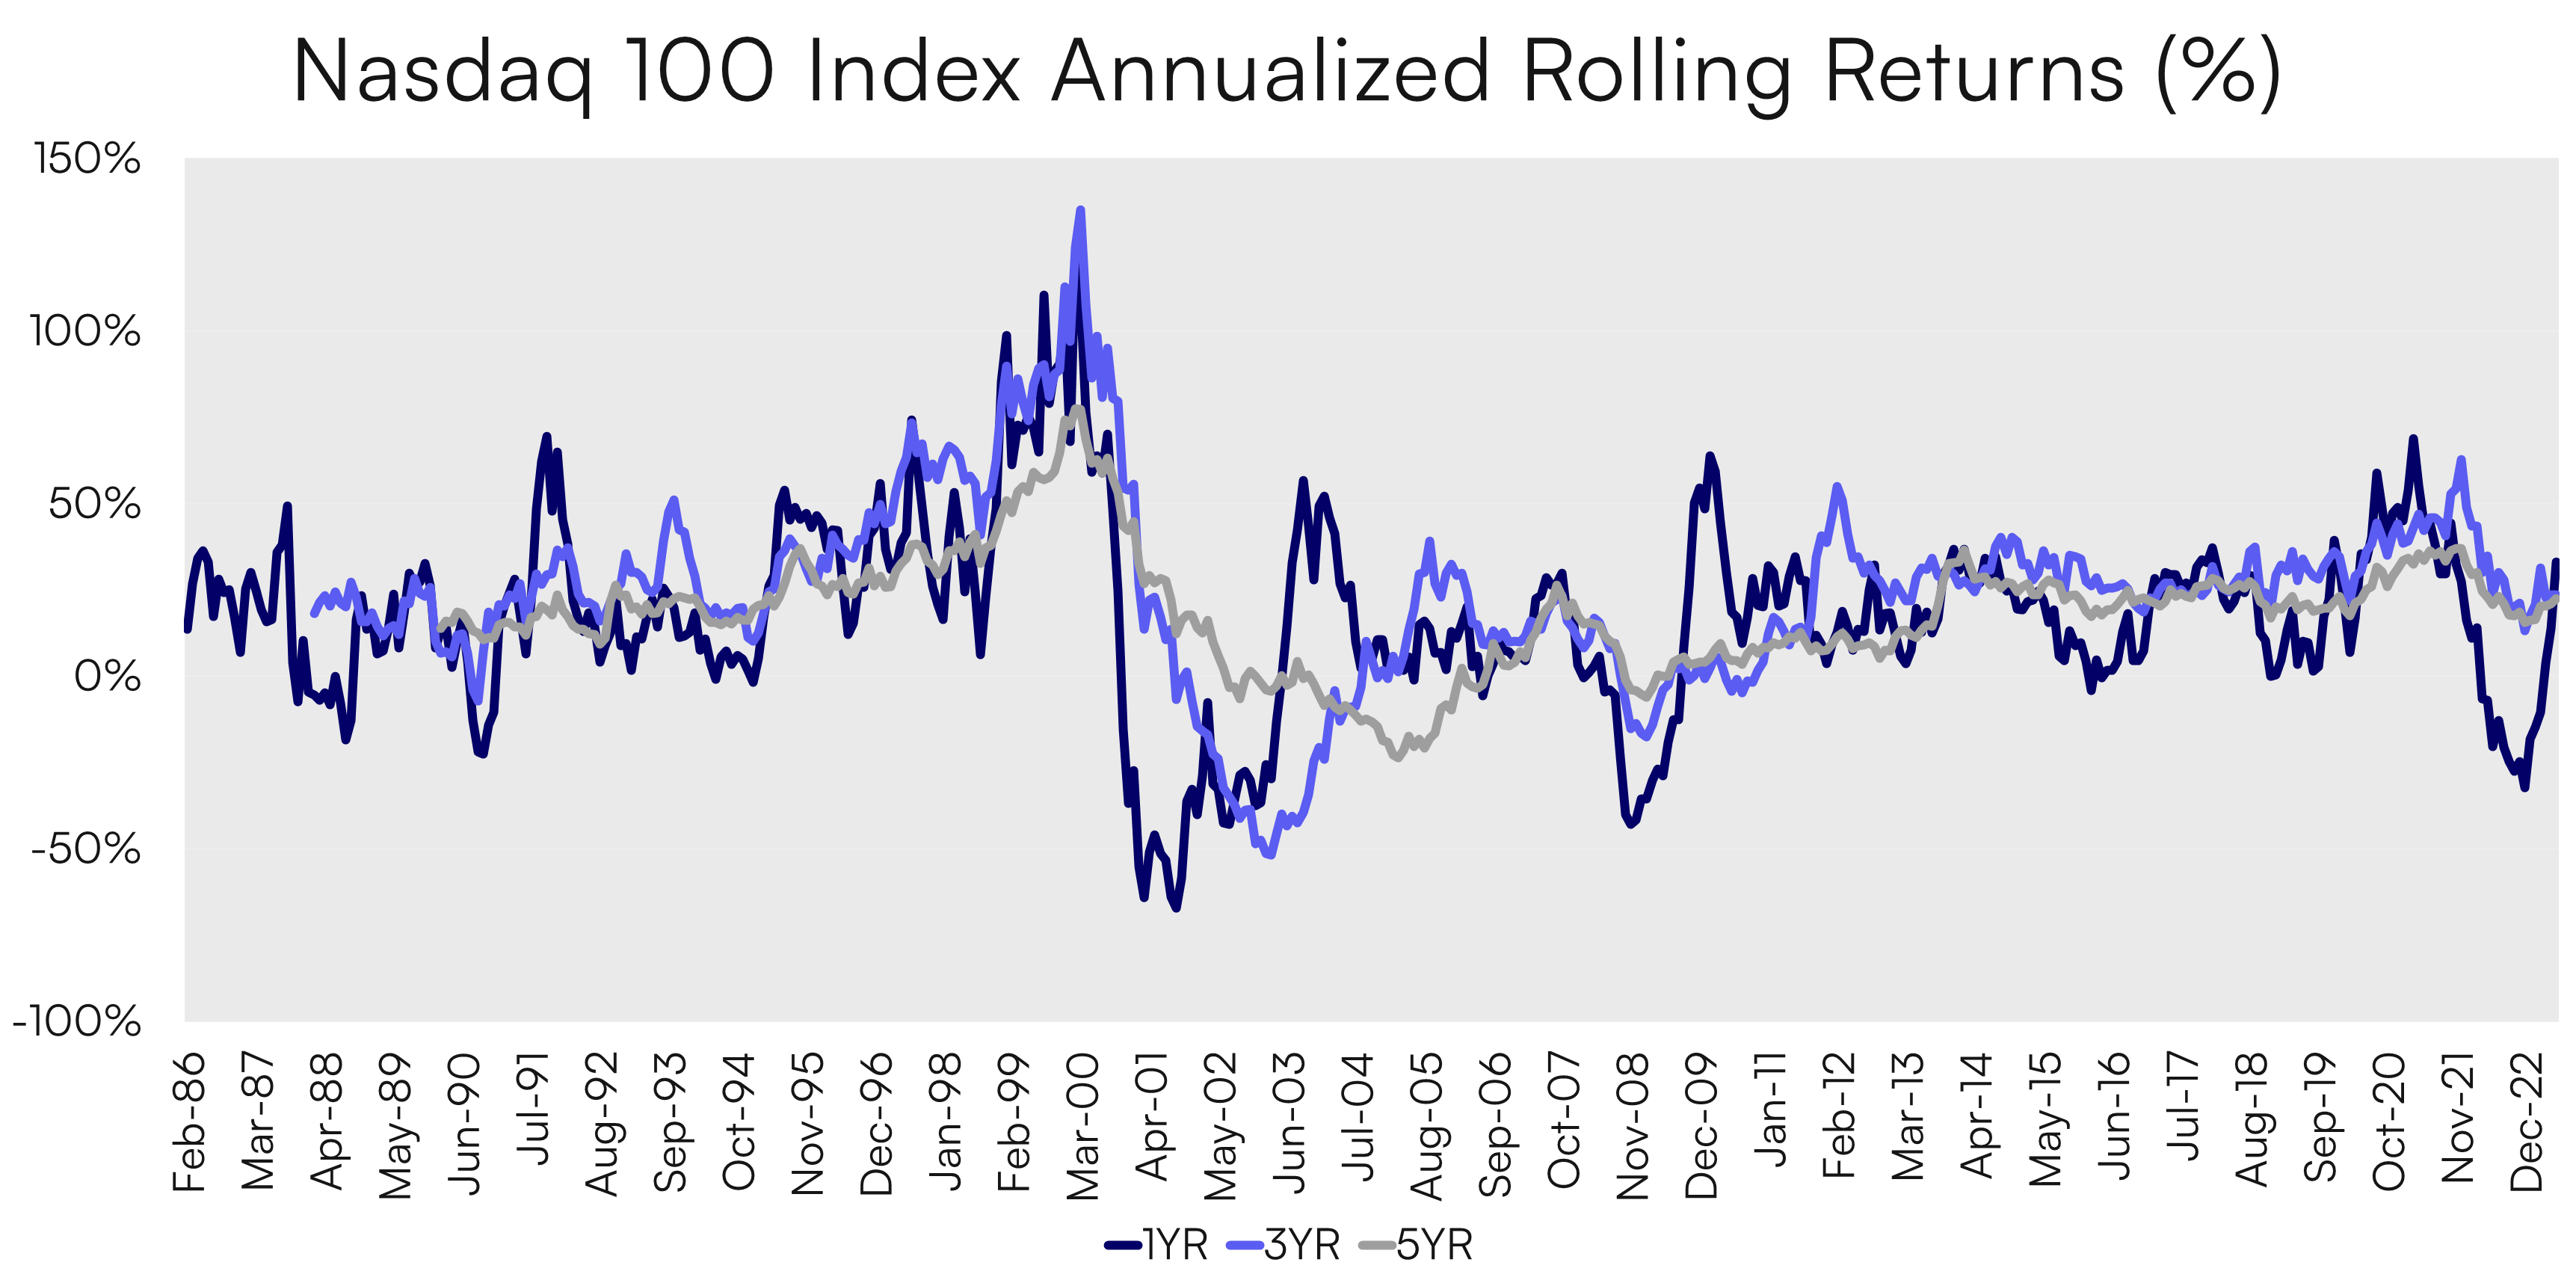
We can see that the tech-heavy Nasdaq 100 Index today remains nowhere near the established bubbles highlighted above, but how does the performance of the Nasdaq 100 Index today compare to the dotcom over multiple time periods?
 Source: Bloomberg, as of July 3, 2023
Note: Indexes are not managed, and one cannot invest directly into an index. Past performance is not a guarantee of future results.
As of the end of June 2023, the rolling returns for the Nasdaq 100 Index have gotten nowhere close to the euphoric levels of the dotcom era. The rolling 1-year and 5-year annualized total return of the Nasdaq 100 Index as of the February 2000 peak stood at 121.8% and 77.6%, respectively. Meanwhile, as of June 2023, the Nasdaq 100’s rolling 1-year and 5-year annualized total return was just 33.1% and 22.5%, respectively. Whether looking at the 1 or 5 year time periods, each are well below the peaks of the dotcom era or even other periods that were not being called bubbles.
But how extreme was the price move in the dotcom era relative to history and how extreme is it today? The z-score is one way to assess this statistically, as it measures the number of standard deviations away from the mean of a data set a single data point is. The higher the score, the more extreme the data point is relative to the entire data set used.
The z-score of the June 2023 1-year return for the Nasdaq 100 Index clocks in at 0.6, far less than the 3.8 reading at the Index’s peak returns in February 2000. In this case, it is saying that the returns through June 2023 are only 0.6 standard deviations above the mean 1-year return of the index whereas the 1-year returns in February 2000 were 3.8 standard deviations above the mean.
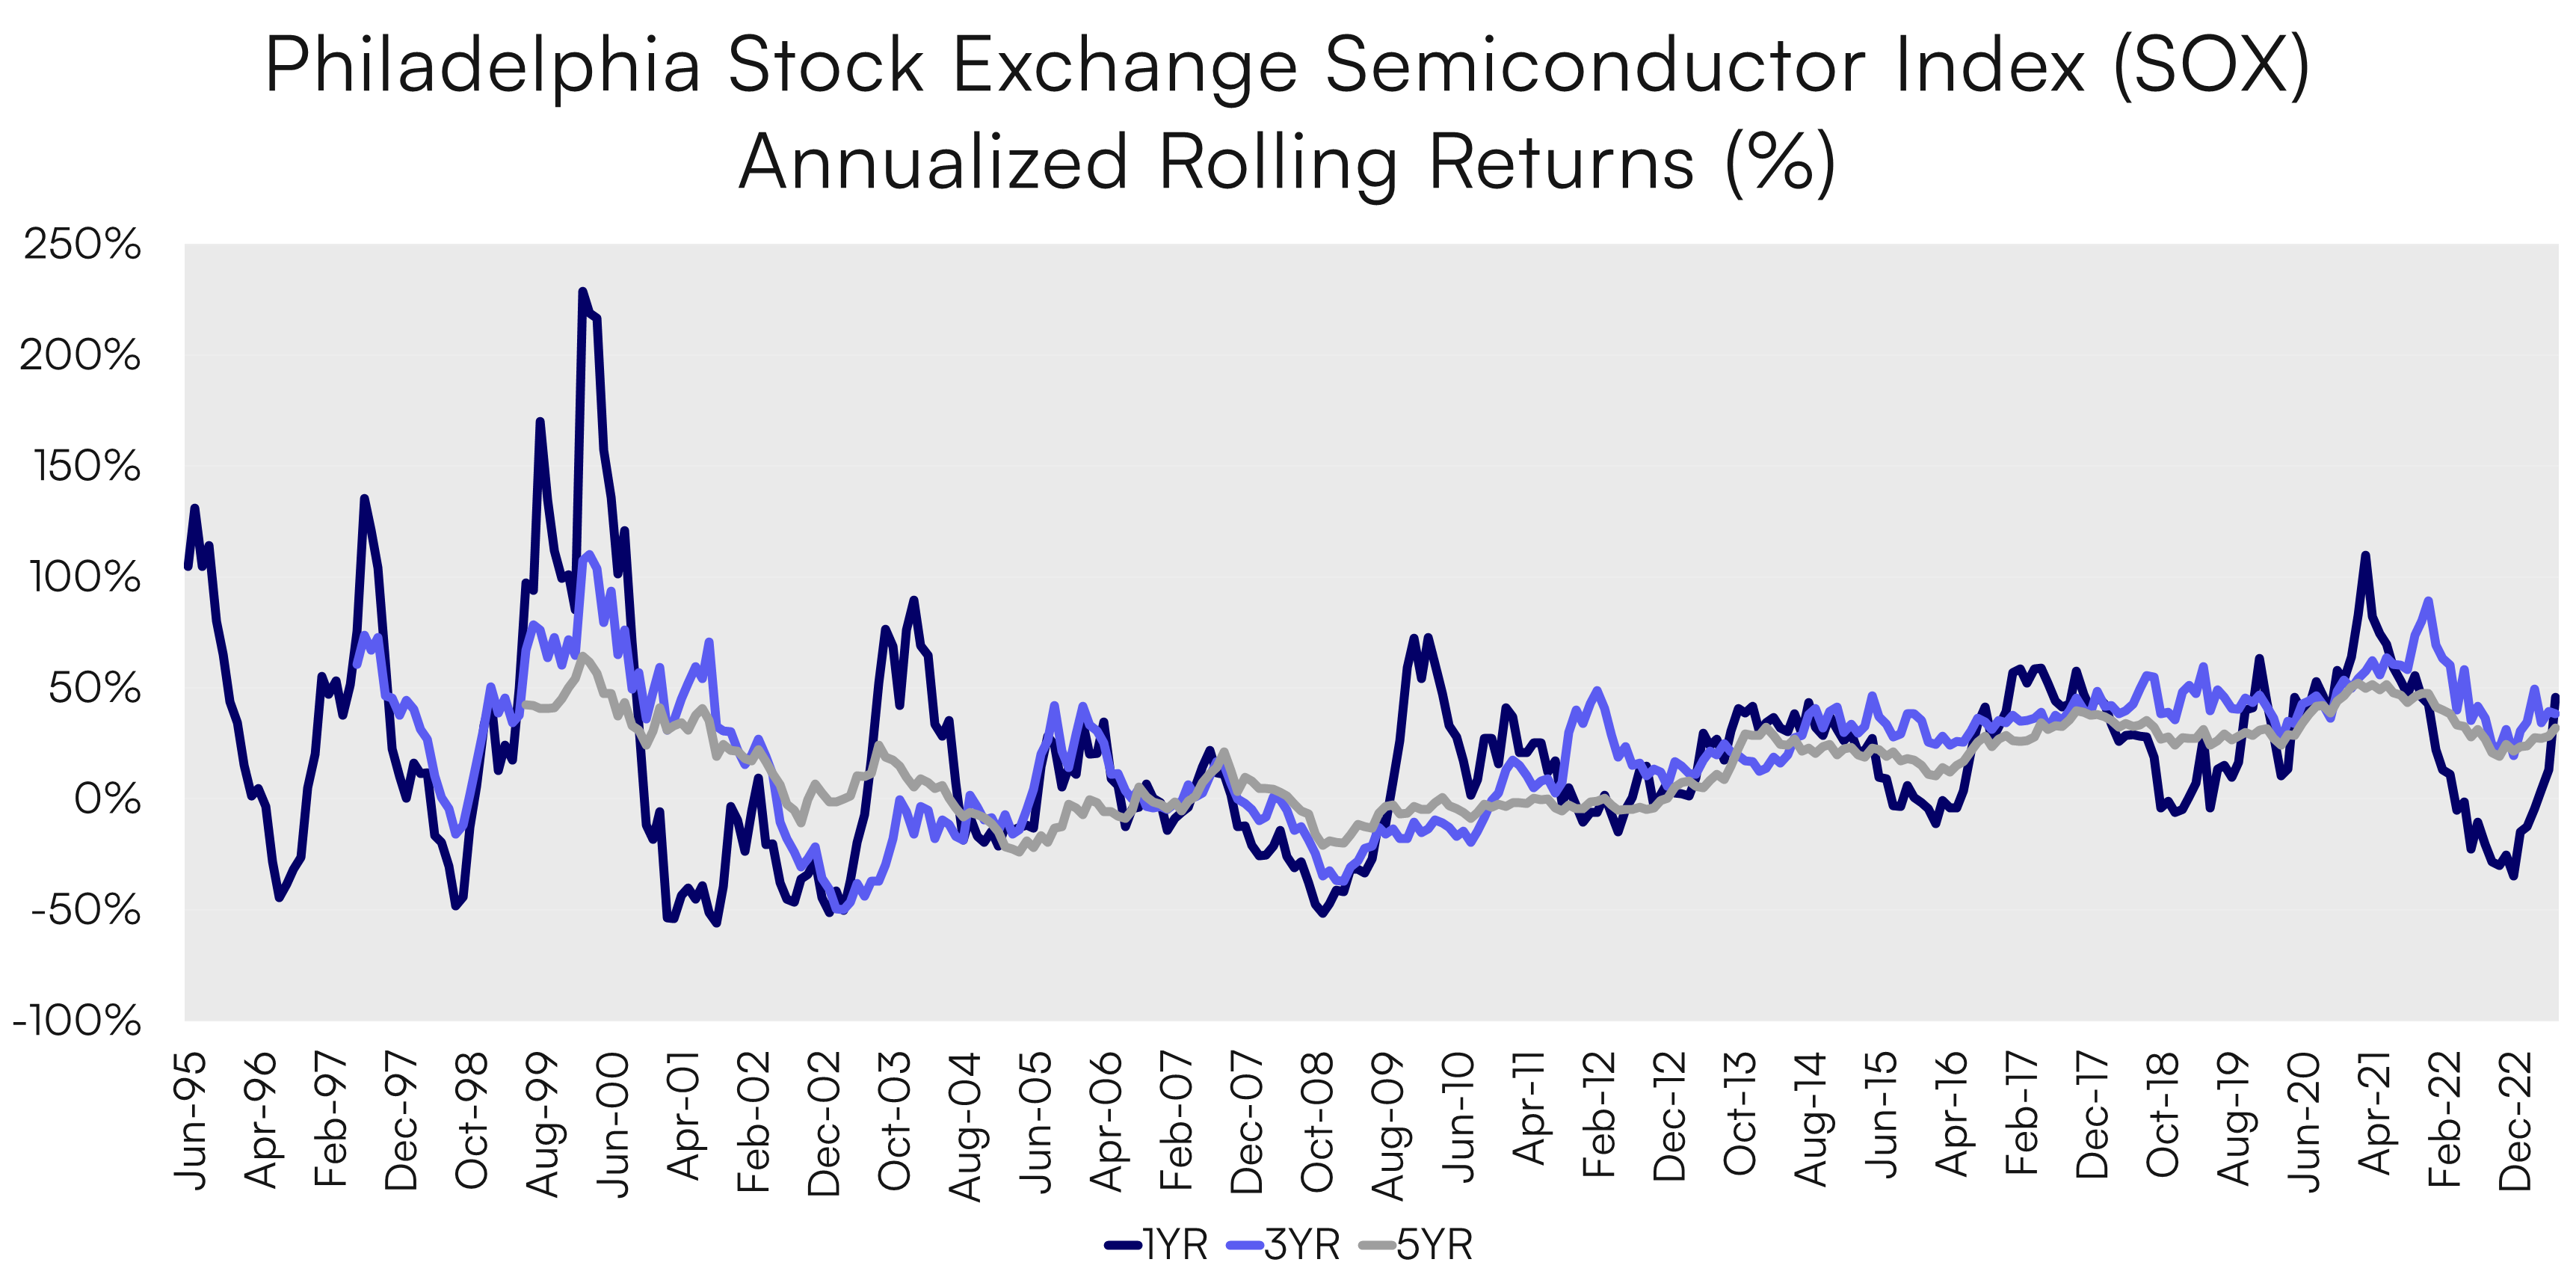
Since the Nasdaq 100 is only around 50% exposed to Information Technology companies, another industry to measure is semiconductors. Chip stocks are an important indicator as they historically have been early indicators of growth cycles in technology. Looking at the Philadelphia Stock Exchange Semiconductor Index (SOX Index), an index tracking the 30 leading semiconductor companies, a similar chart pattern to the Nasdaq is apparent.
Source: Bloomberg, as of July 3, 2023
Note: Indexes are not managed, and one cannot invest directly into an index. Past performance is not a guarantee of future results.
For the SOX Index, the rolling 1-year and 5-year annualized total return peaked in February 2000 at 228.9% and 64.4%, respectively. As of the end of June 2023, the SOX Index’s rolling 1-year and 5-year annualized total returns were just 45.8% and 31.9%, respectively, well below the peaks of the dotcom era.
Looking at the z-score for the returns, the data similarly shows that the 1-year return of the SOX Index is not nearly as far displaced from the long-term average as it was in the dotcom era. The z-score of the SOX Index’s 1-year returns in June 2023 was just 0.6, meaning it was only 0.6 standard deviations above the long-term average. This compares to the 4.7 z-score it had in Feb. 2000, which meant that the one-year return of the Index at that point was 4.7 standard deviations above the long-term mean.
From a returns perspective whether in absolute terms or in z-score terms, today’s returns are far from the dotcom bubble.
Bubble Check: No ❌
High Valuations
Stretched valuations may also be indicative of market bubbles. We analyze two representative baskets of companies to compare the dotcom bubble to today’s market in terms of valuation as defined by the price to earnings multiple.
- The “MAN” Basket – Consisting of Microsoft, Alphabet and Nvidia, three perceived leaders of the generative AI revolution and the three-largest holdings in the CHAT ETF as of June 30, 2023.
- The “Four Horsemen” of the Dotcom Bubble Era – Microsoft, Intel, Cisco and Dell Computers.
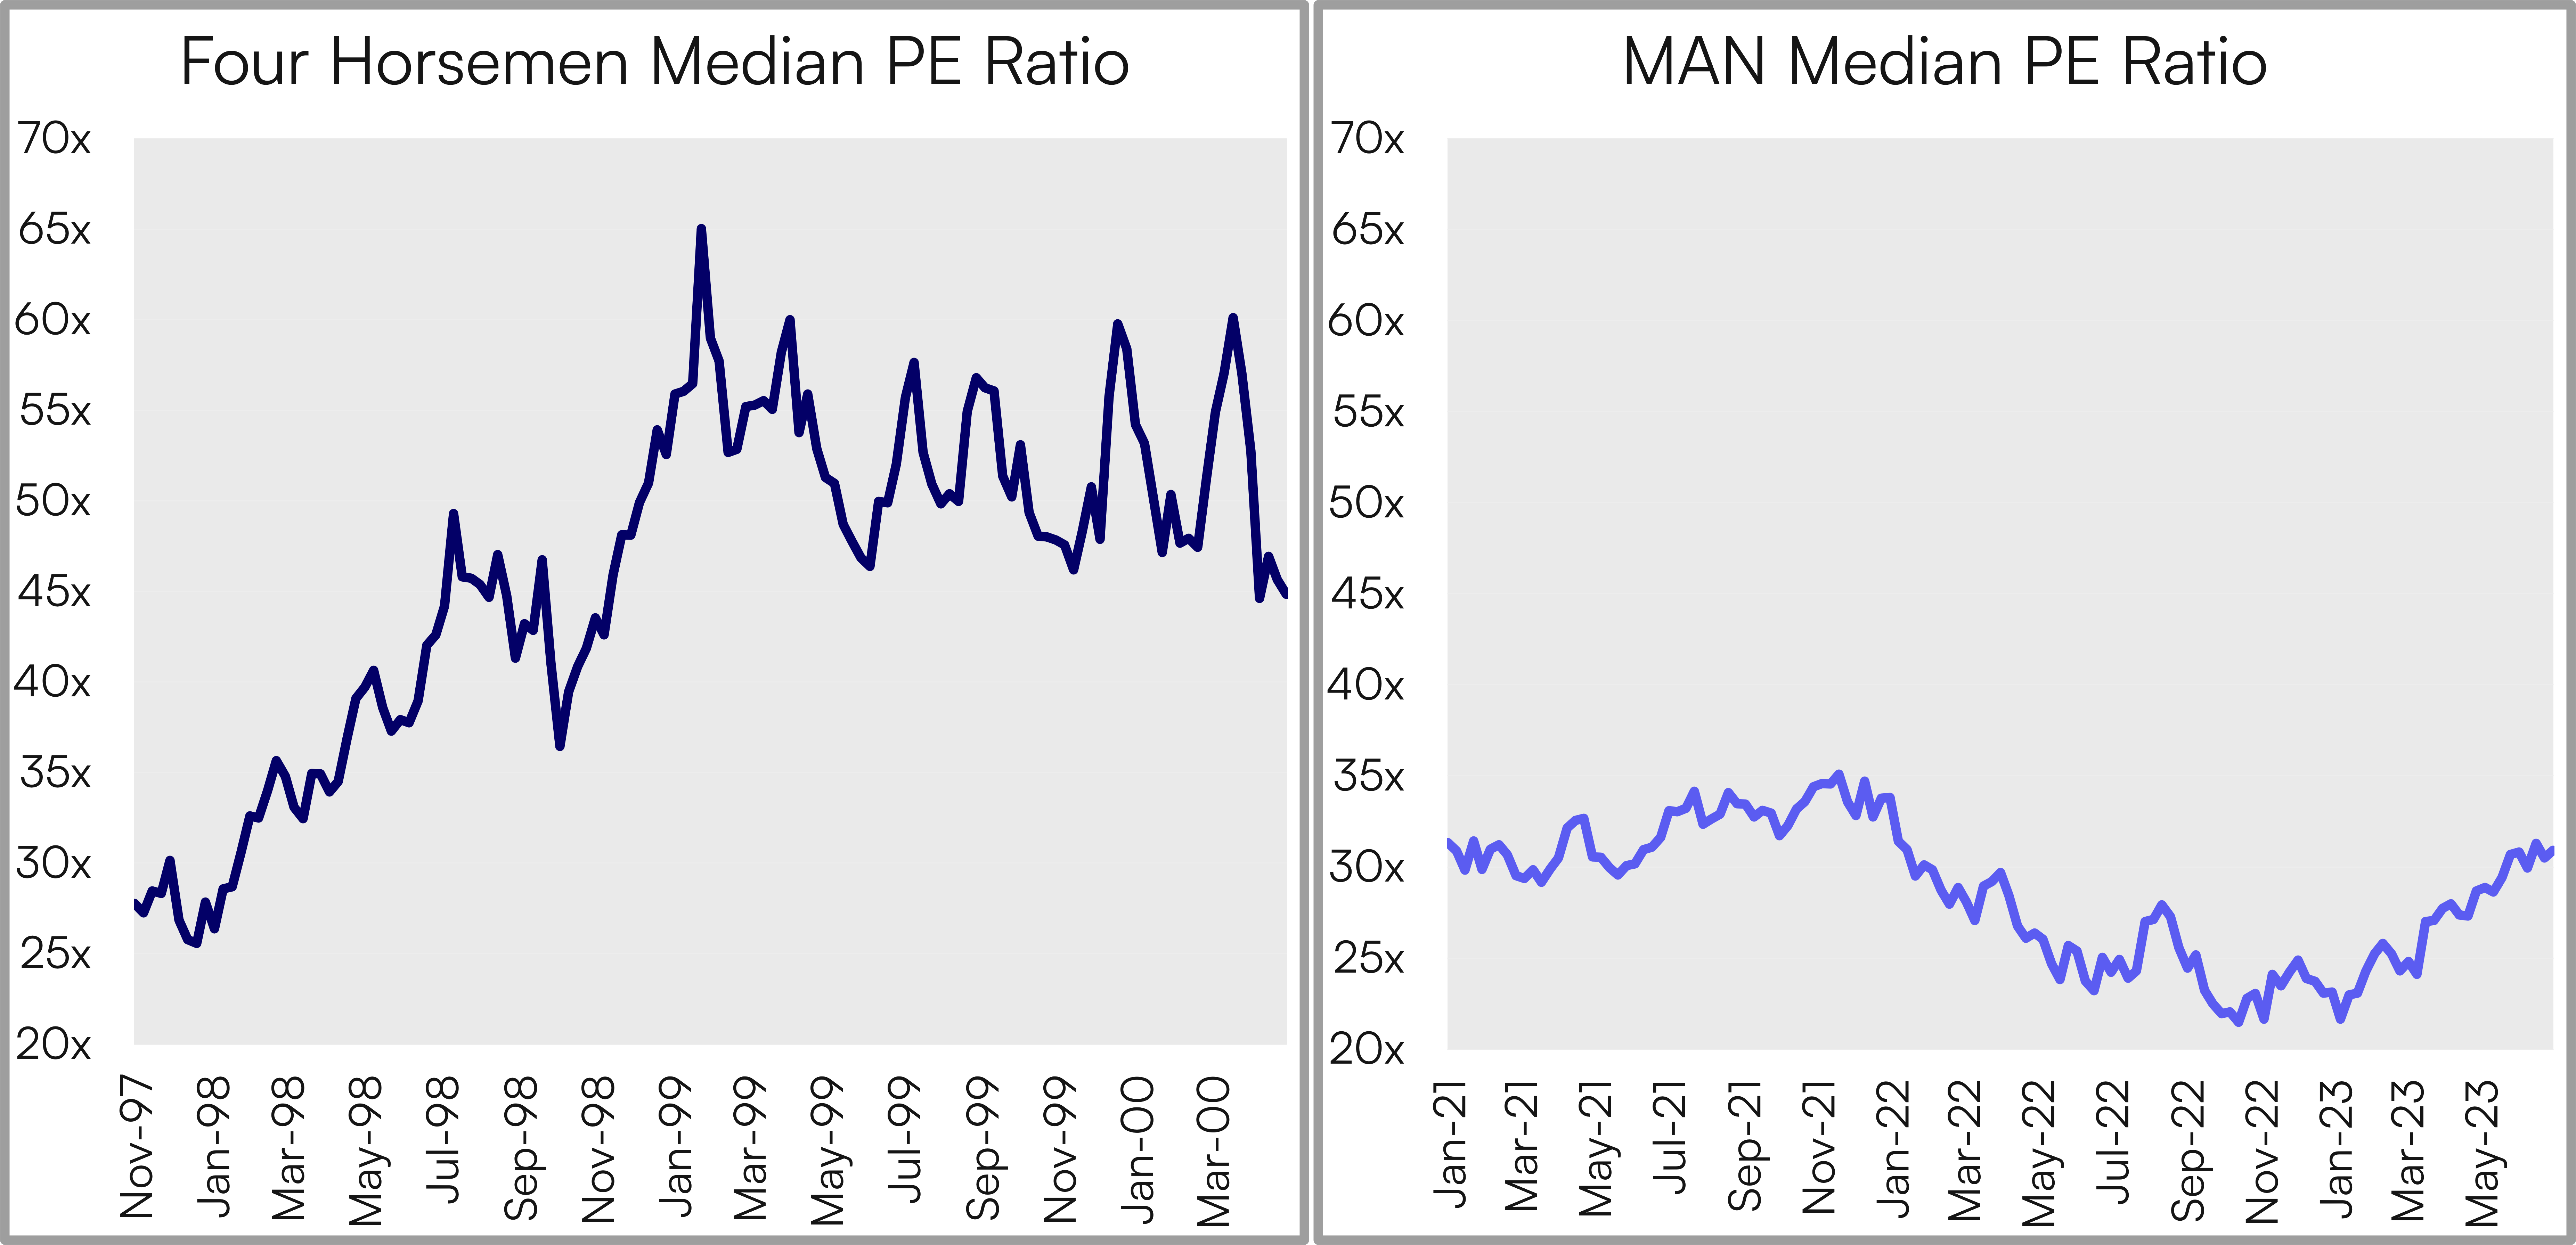
Source: Bloomberg, Roundhill Investments, as of July 3, 2023
Note: Past performance is not a guarantee of future results.
The median forward P/E ratio9 of the four horsemen peaked at 65x in January 1999, well above the current 30.9x median of the MAN Basket. In fact, the AI-exposed MAN stocks trade at lower multiples today than two years ago. In our view, this provides additional comfort that valuations for leading generative AI companies are not yet stretched, especially relative to what we saw in the dotcom era.
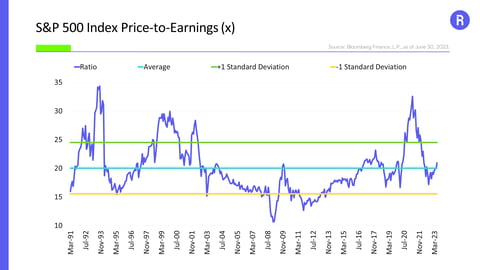
Comparing the peak multiple of the broad-market Nasdaq 100 Index during the dotcom era and today can also demonstrate that valuations are not yet stretched. According to Nasdaq, the peak P/E ratio of the Nasdaq 100 Index was north of 250x during the dotcom era while the index closed June 2023 at 26.3x, nearly 90% lower than the dotcom era.
So, like performance, we believe that equity multiples for both the MAN basket and the broader index are not extreme.
Bubble Check: No ❌
Case Study: Cisco vs. Nvidia
To take this a step further, let us explore a single stock case study.
During the dotcom era, Cisco was seen as a primary beneficiary from the projected acceleration of investments in Internet infrastructure given its position as a leading supplier of networking gear. Similarly, Nvidia today is seen as a beneficiary of the investment cycle into accelerated compute systems for generative AI.
For representative purposes, we compare Cisco’s share price and forward P/E ratio trend from its pre-dotcom bubble low to its peak in March 2000 compared to Nvidia since its October 2022 low.
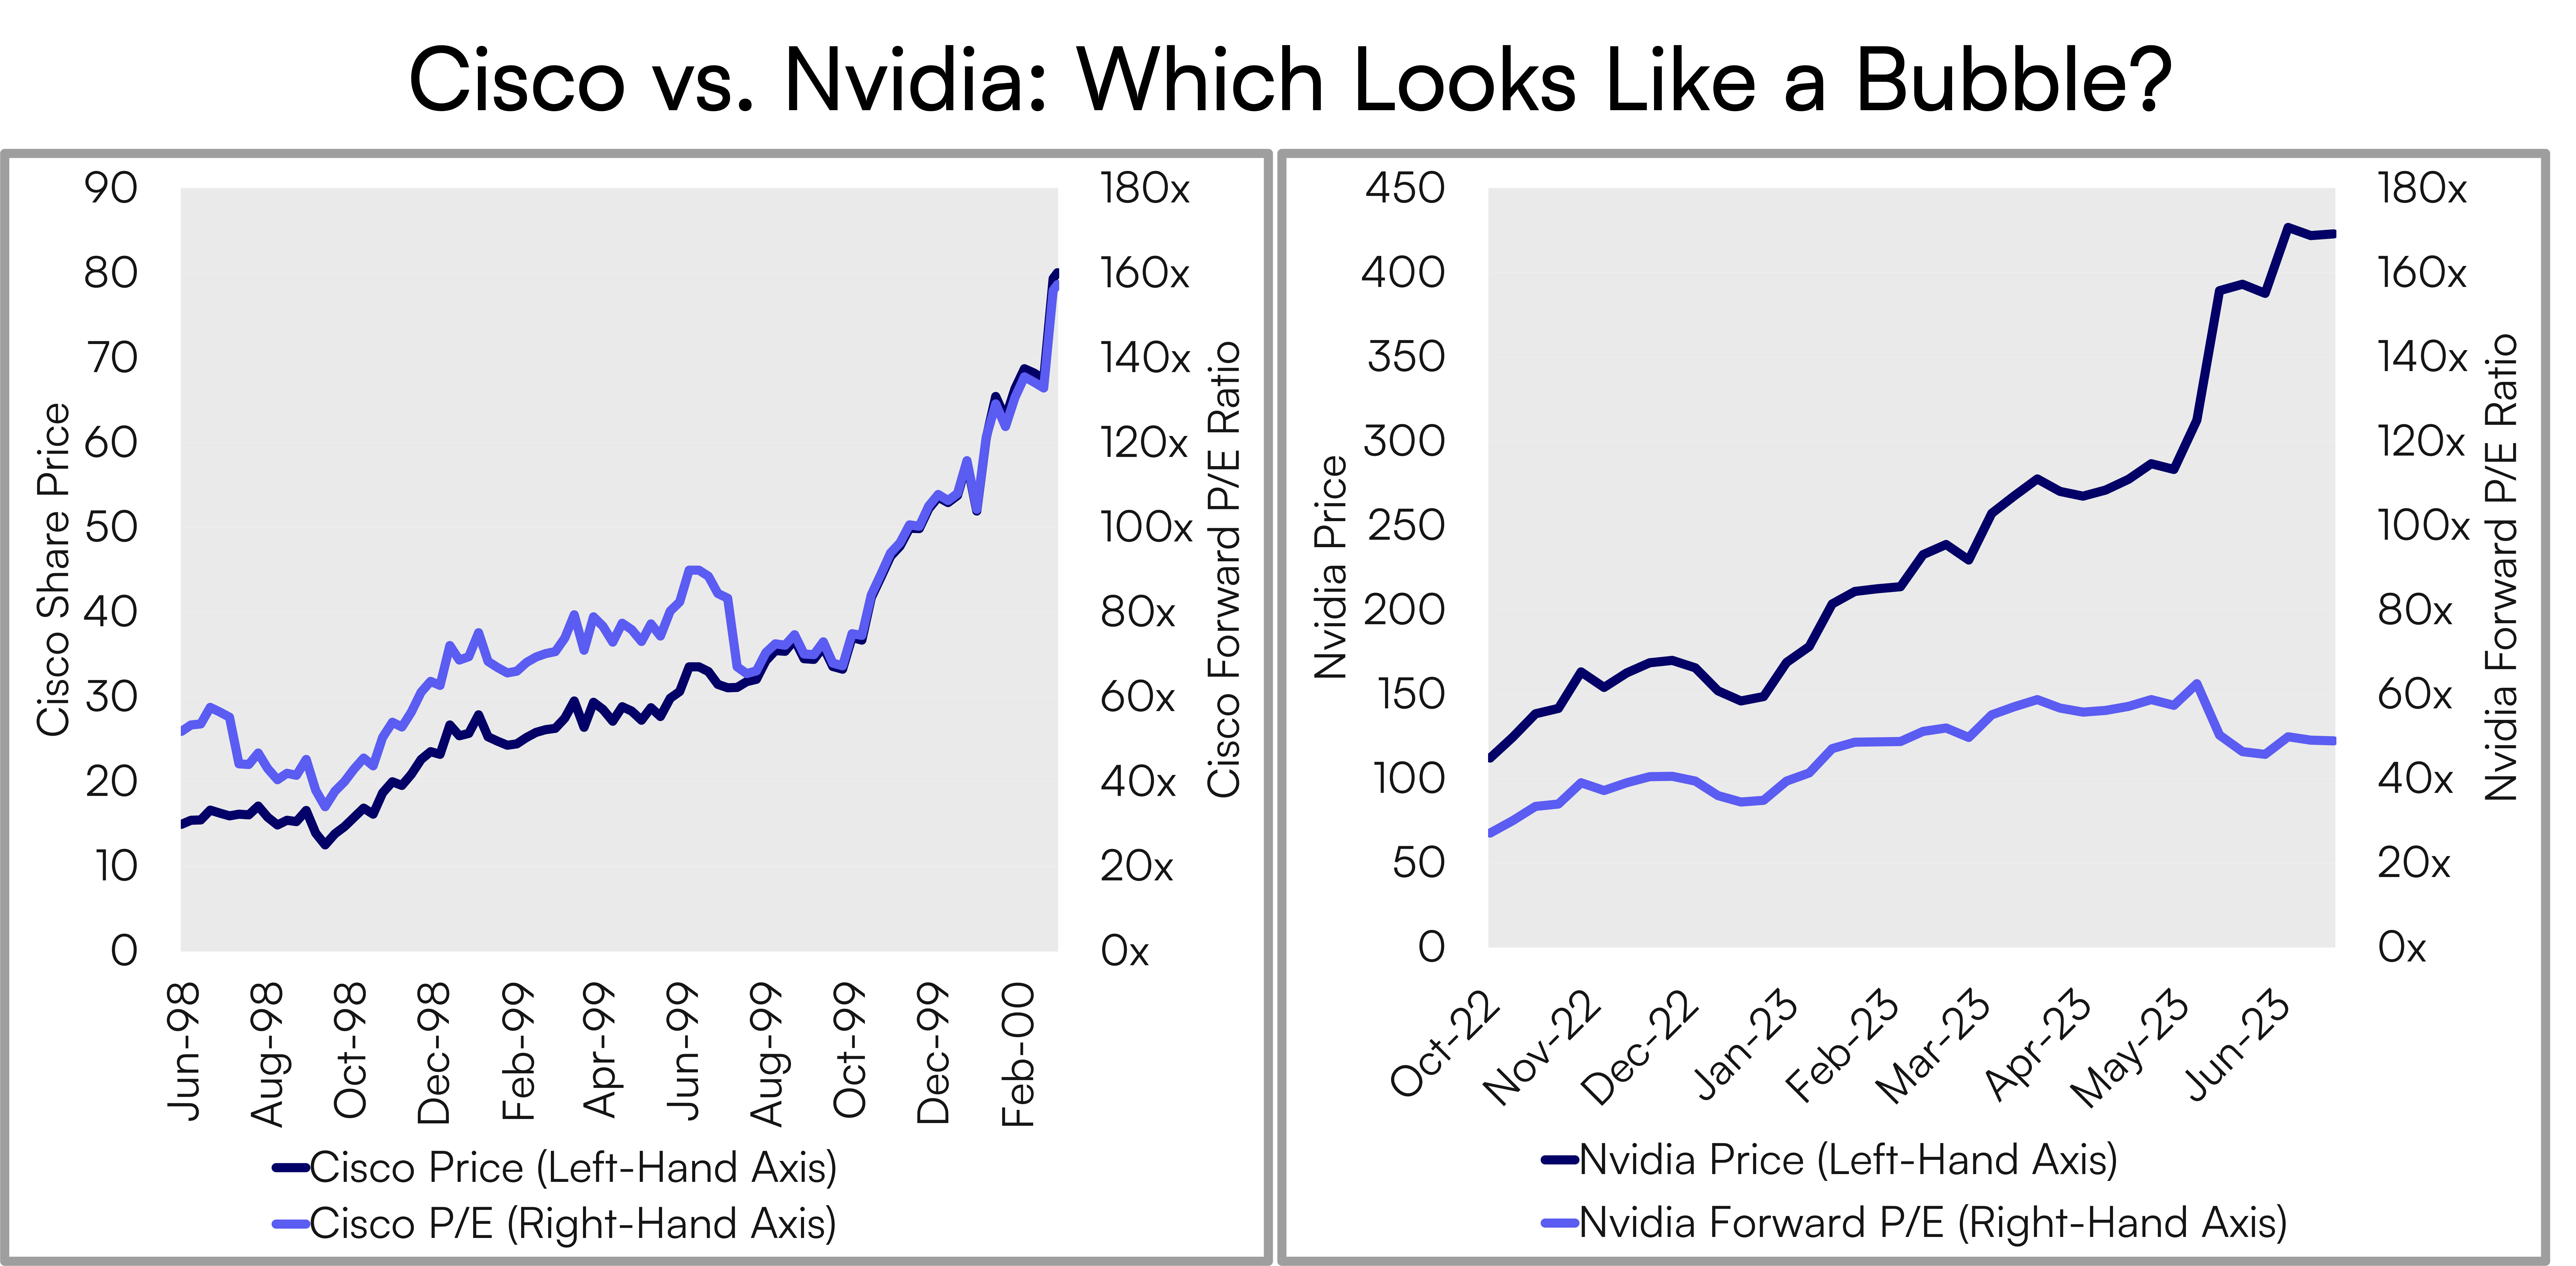
Source: Bloomberg, as of July 3, 2023
Note: Cisco and Nvidia chosen as representative leaders of technology hardware sectors in dotcom era and recent AI bull market, respectively; Cisco date range chosen to reflect share price and forward P/E multiple rally from June, 1998 low through March 2000 peak; Nvidia forward P/E aligned from share price and forward P/E low in October, 2022.
Note: Past performance is not a guarantee of future results.
Nvidia’s share price gains and multiple expansion since its October 2022 price lows have not yet matched the ascent of Cisco during the dotcom bubble. Cisco went from trading at a forward P/E ratio of 51.8x in June of 1998 to 157.3x forward earnings in March of 2000. Nvidia ended June, 2023 at 48.9x forward earnings, up from a forward P/E in October 2022 of 26.8x. Nvidia’s nominal and relative multiple expansion have not come anywhere close to those witnessed during the dotcom era.
Bubble Check: No ❌
Weak Fundamentals
The underlying fundamentals of leading AI companies are also much stronger in the current market than tech companies during the dotcom era. The following chart compares the key fundamental metrics of Microsoft, Alphabet and Nvidia – the MAN companies that are among the leaders of the generative AI revolution – against the Four Horsemen at the peak of the Dotcom era.
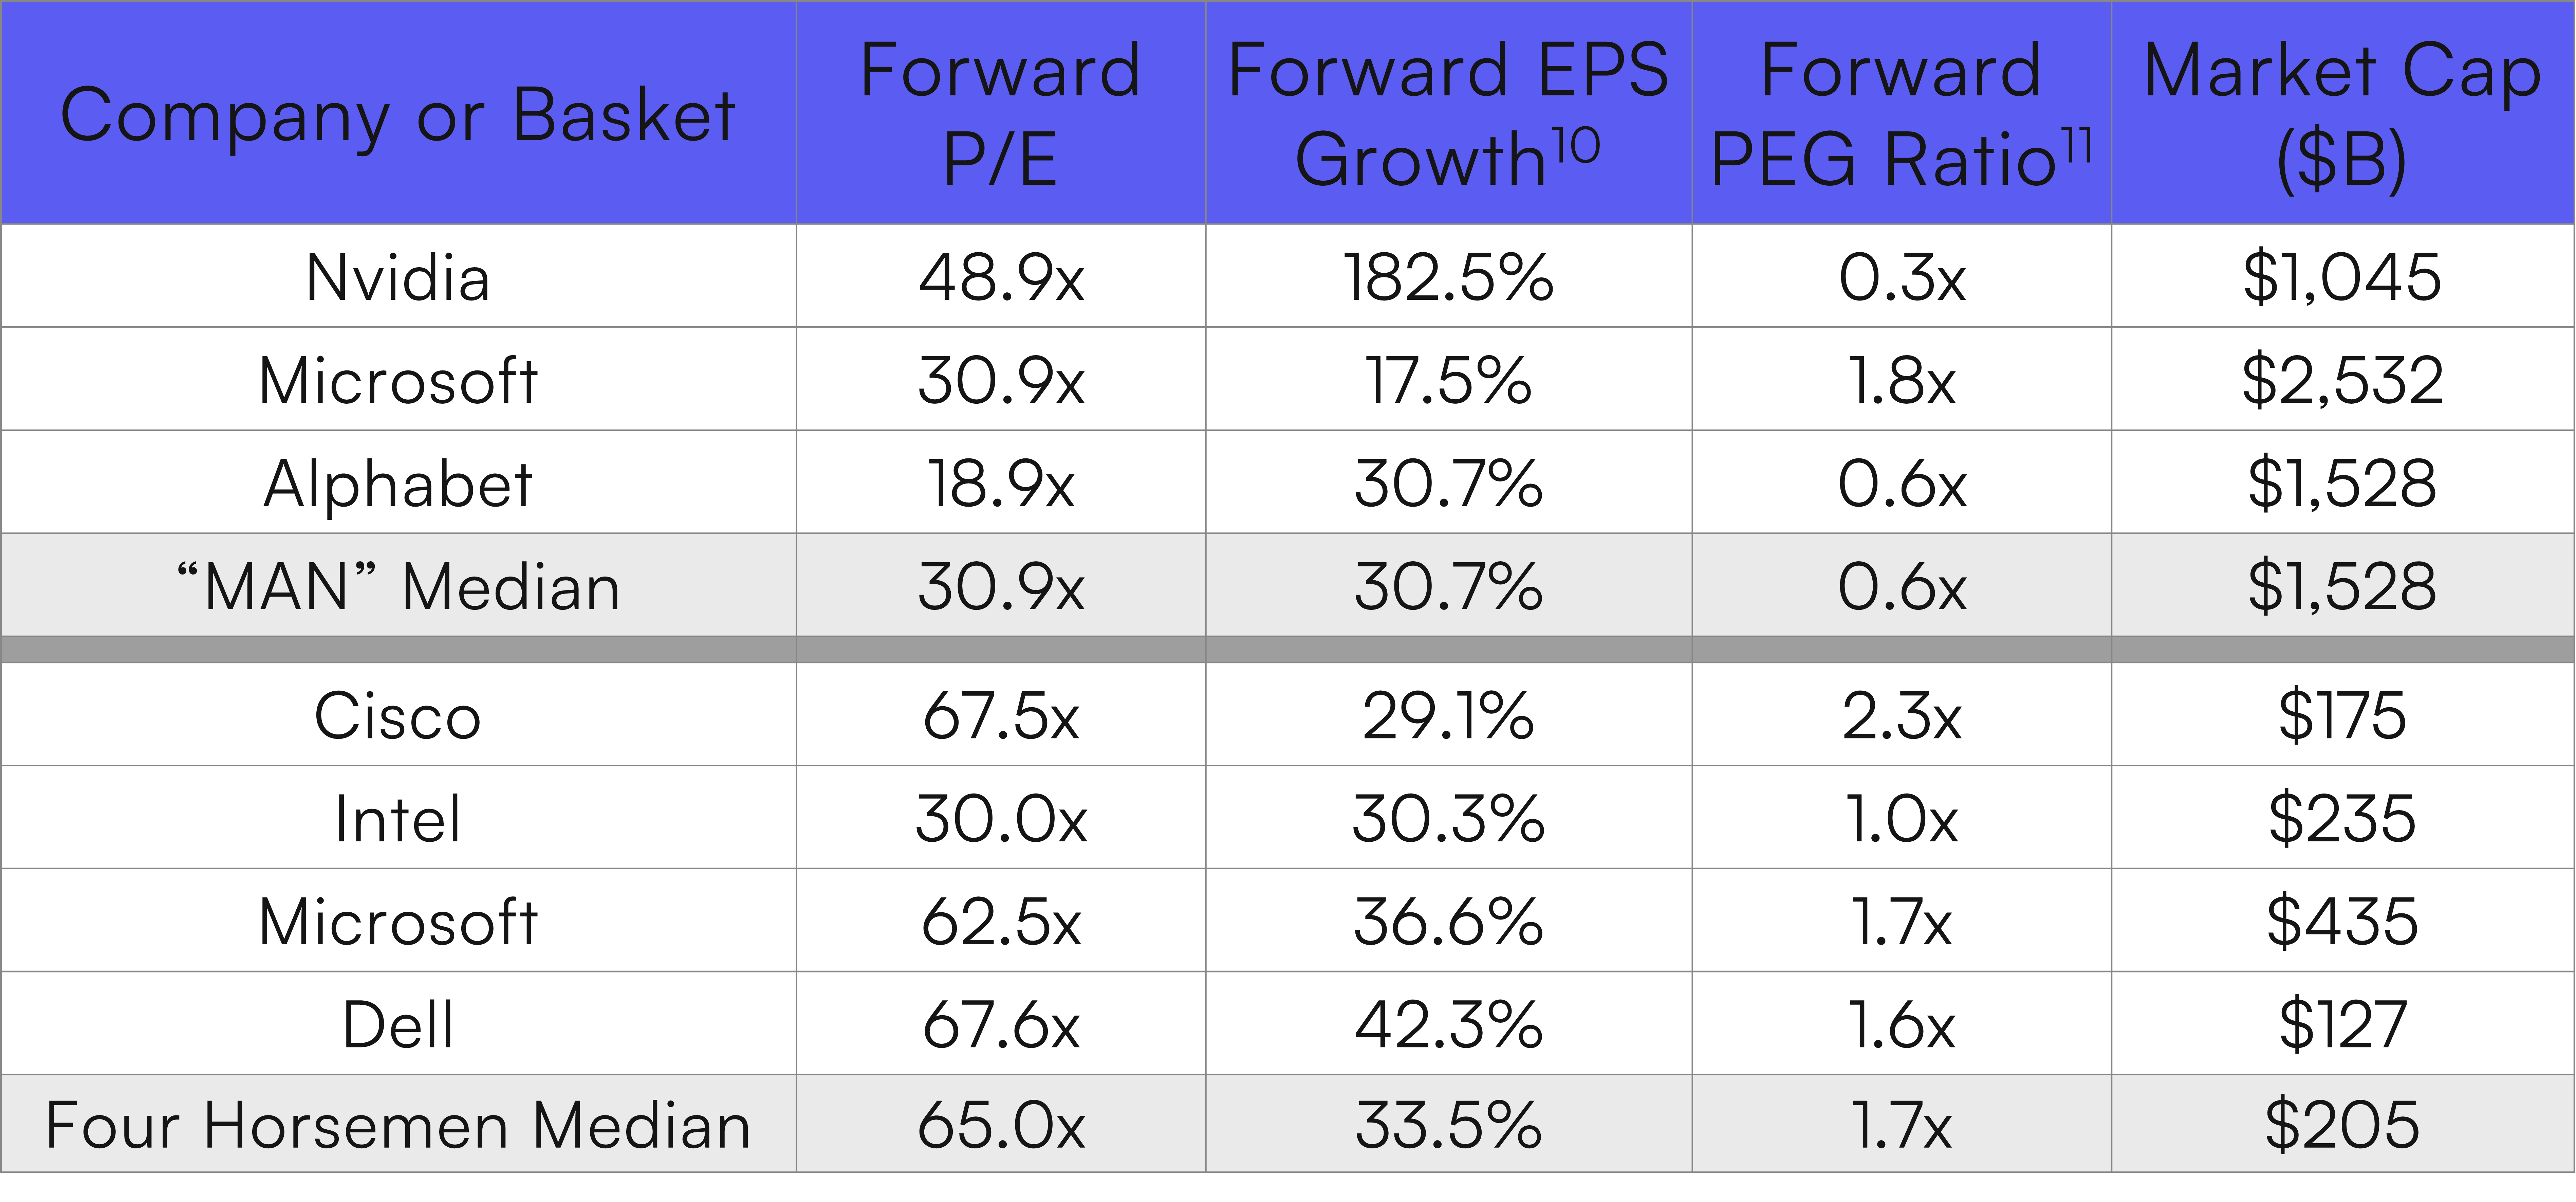
Source: Bloomberg, July 3, 2023
Note: Data for “MAN” companies as of June 30, 2023; data for “Four Horsemen” as of January 1999
The current median forward P/E of the MAN Basket (30.9x) is less than half that of the Four Horsemen in January 1999 (65.0). Further, the median forward price-to-earnings-to-growth (PEG) ratio of the MAN Basket at 0.6x is similarly well below that of the Four Horsemen at 1.7x. In other words, investors in the “MAN stocks” are being rewarded with higher growth potential at lower valuations.
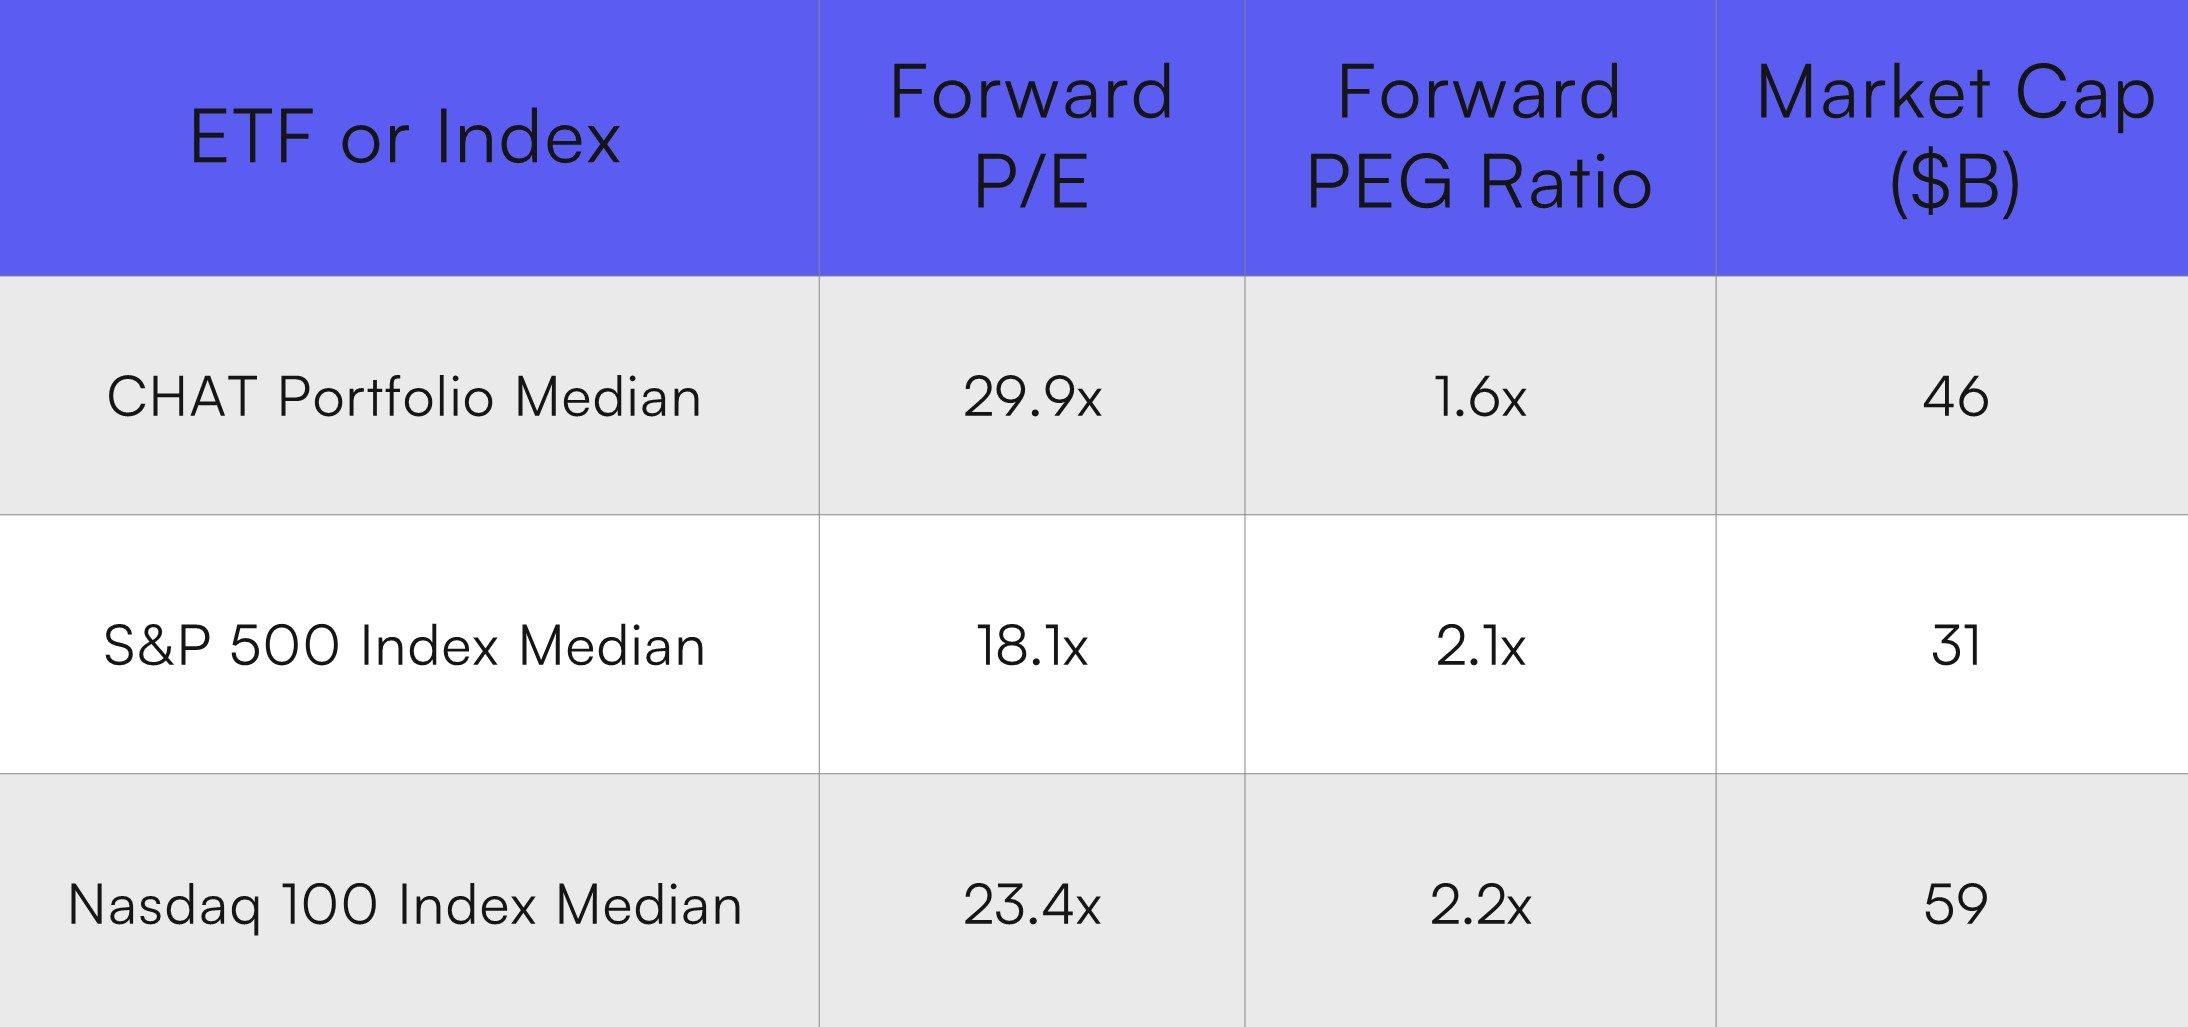
Source: Bloomberg, July 3, 2023
Note: Indexes are not managed, and one cannot invest directly into an index.
In the table above, we compare the Roundhill Generative AI & Technology ETF (NYSE Arca: CHAT) against broad market indices represented by the S&P 500 Index2 and the Nasdaq 100 Index. Based on our analysis, we can see the median PEG ratio of CHAT is 1.6x, below the S&P 500 Index at 2.1x and the Nasdaq’s at 2.2x.
Bubble Check: Not Yet ❌
Hot IPO Market
The IPO market can also be a signal for sentiment and the euphoria surrounding a bubble. When companies are rushing to sell stock, it can be a sign of extended valuations and a potential bubble. In the dotcom era, the U.S. IPO market was extremely hot, with capital raised in U.S. IPOs peaking at $103.7 billion in 1999.
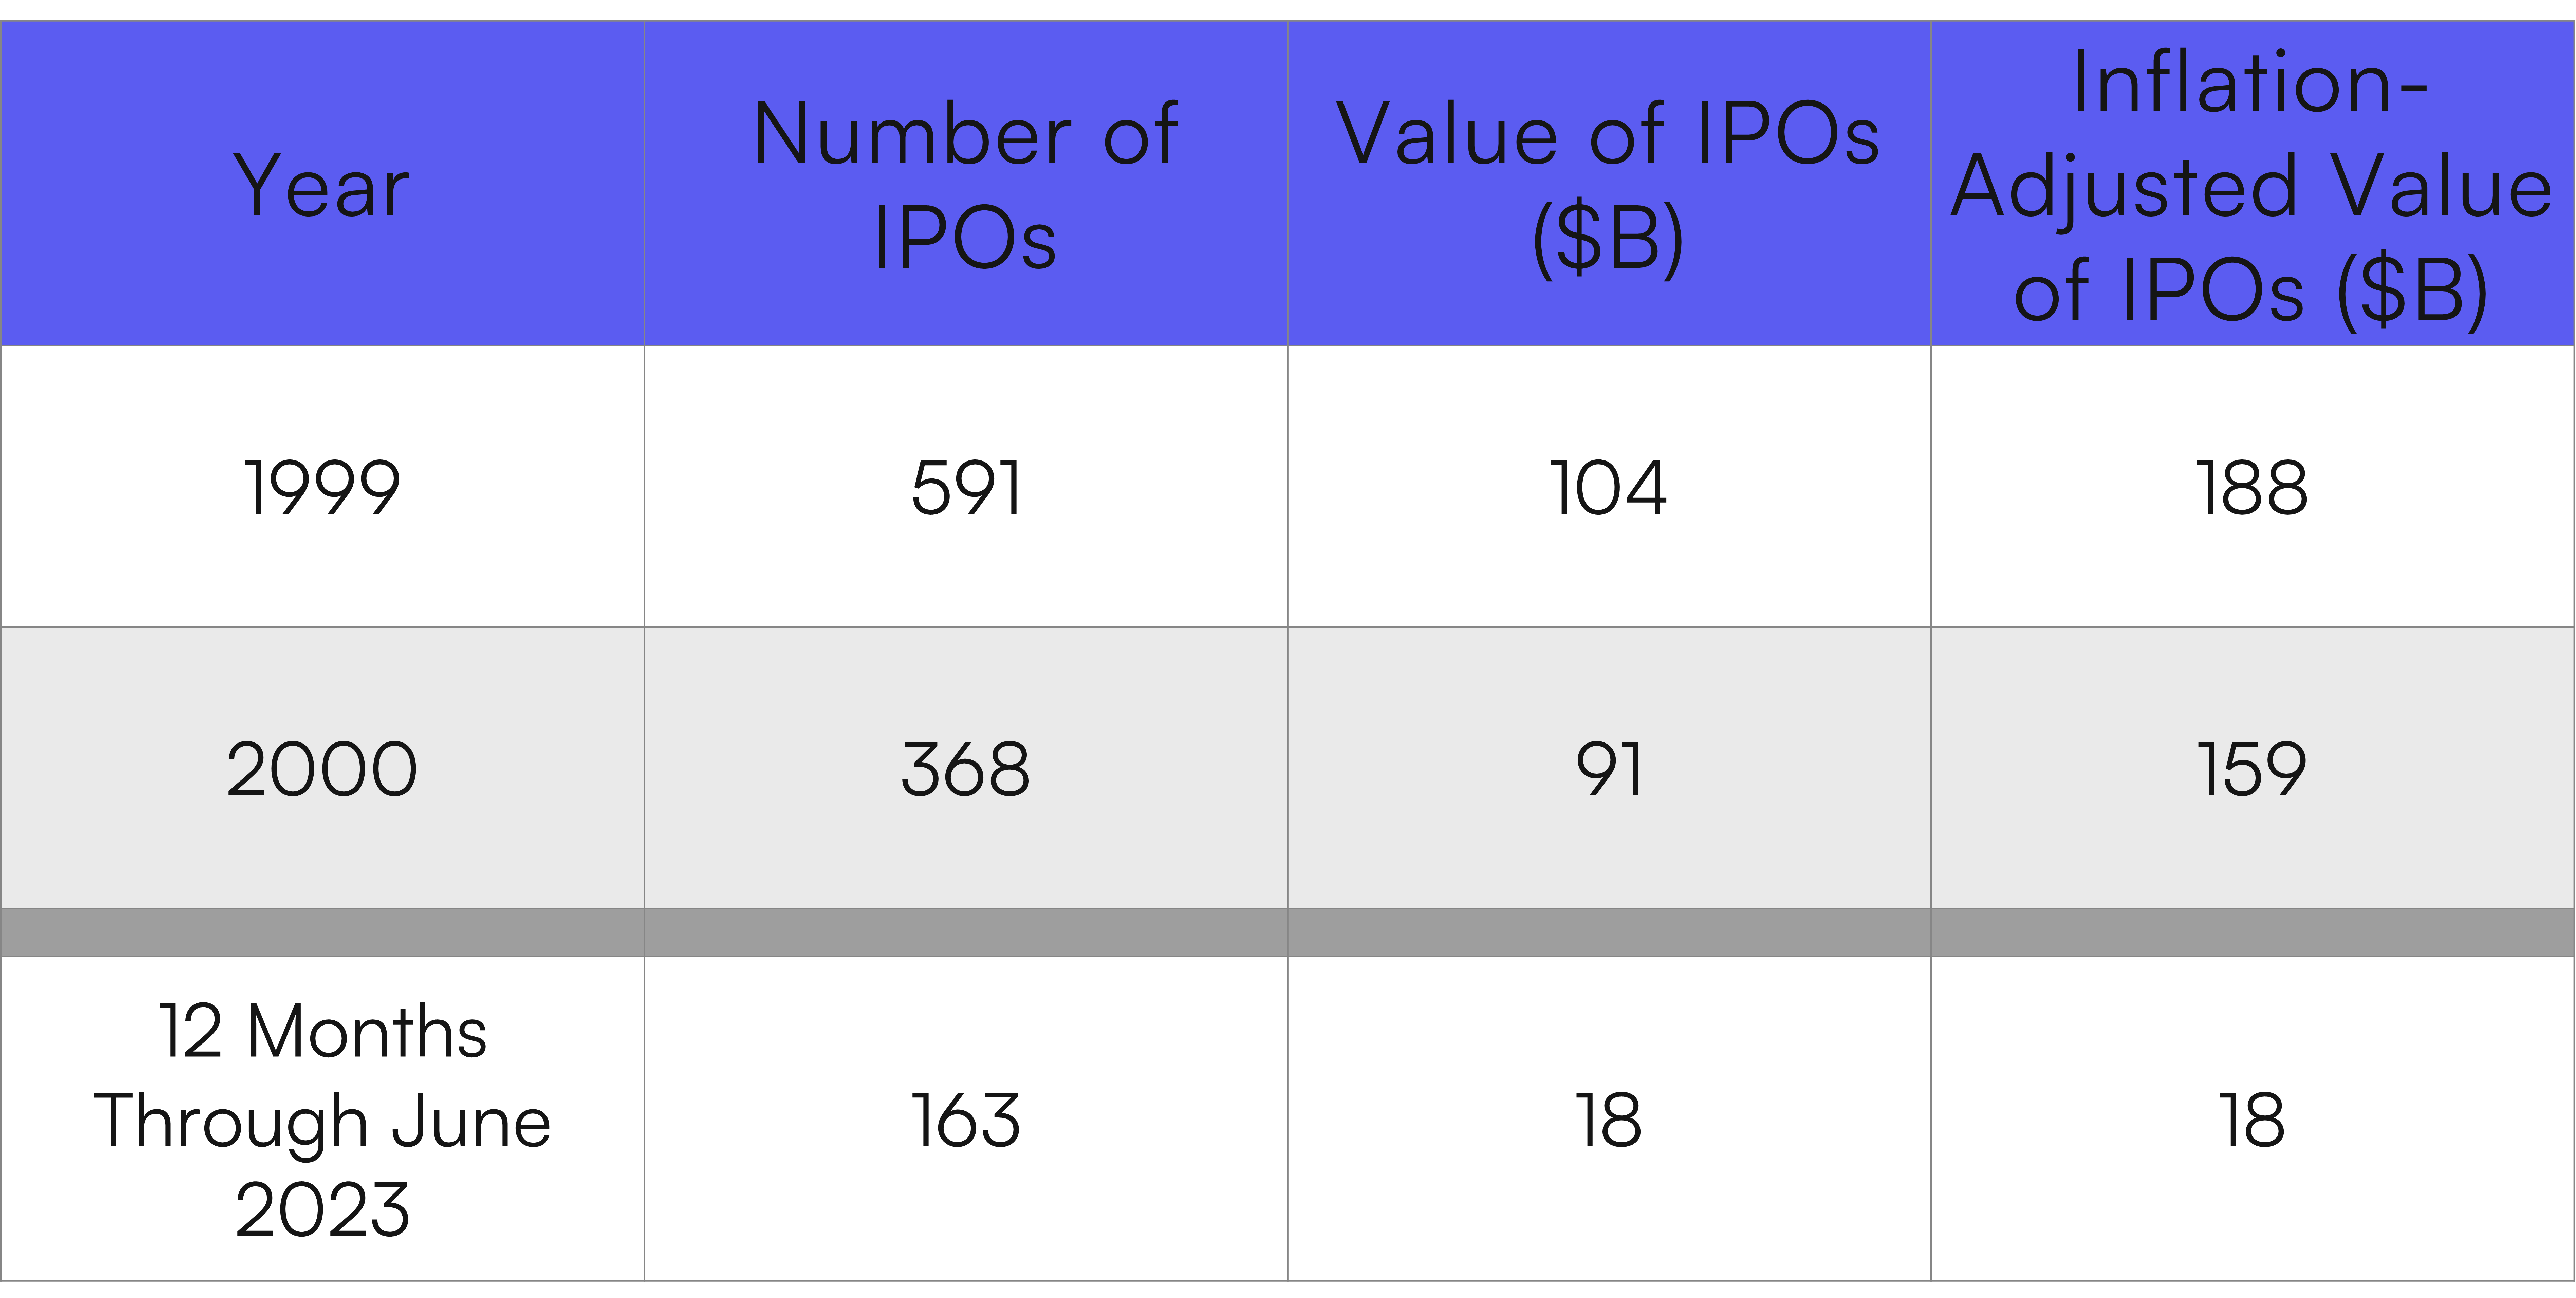
Source: Bloomberg, as of June 30, 2023
Note: Inflation-adjusted value adjusts 1999 and 2000 values to current dollars for comparability purposes using the Bureau of Labor Statistics calculations.
Although the U.S. IPO market hit a new record in 2021 raising $339 billion from over 1,000 deals, the market has been nearly frozen since. So far in 2023, there have been just 75 IPOs raising $10.6 billion, according to Bloomberg data. Generative AI only became a major technology trend in late 2022 with the release of ChatGPT, so most of the IPO buzz in 2021 could not be attributed to any sort of “AI bubble”.
The relative craze of the dotcom era is also apparent when we look at the first day trading activity for IPOs. For IPOs that raised more than $100 million in the U.S., there were just two that popped 50% or more in 2023 versus 57 deals that rose that much in 1999.
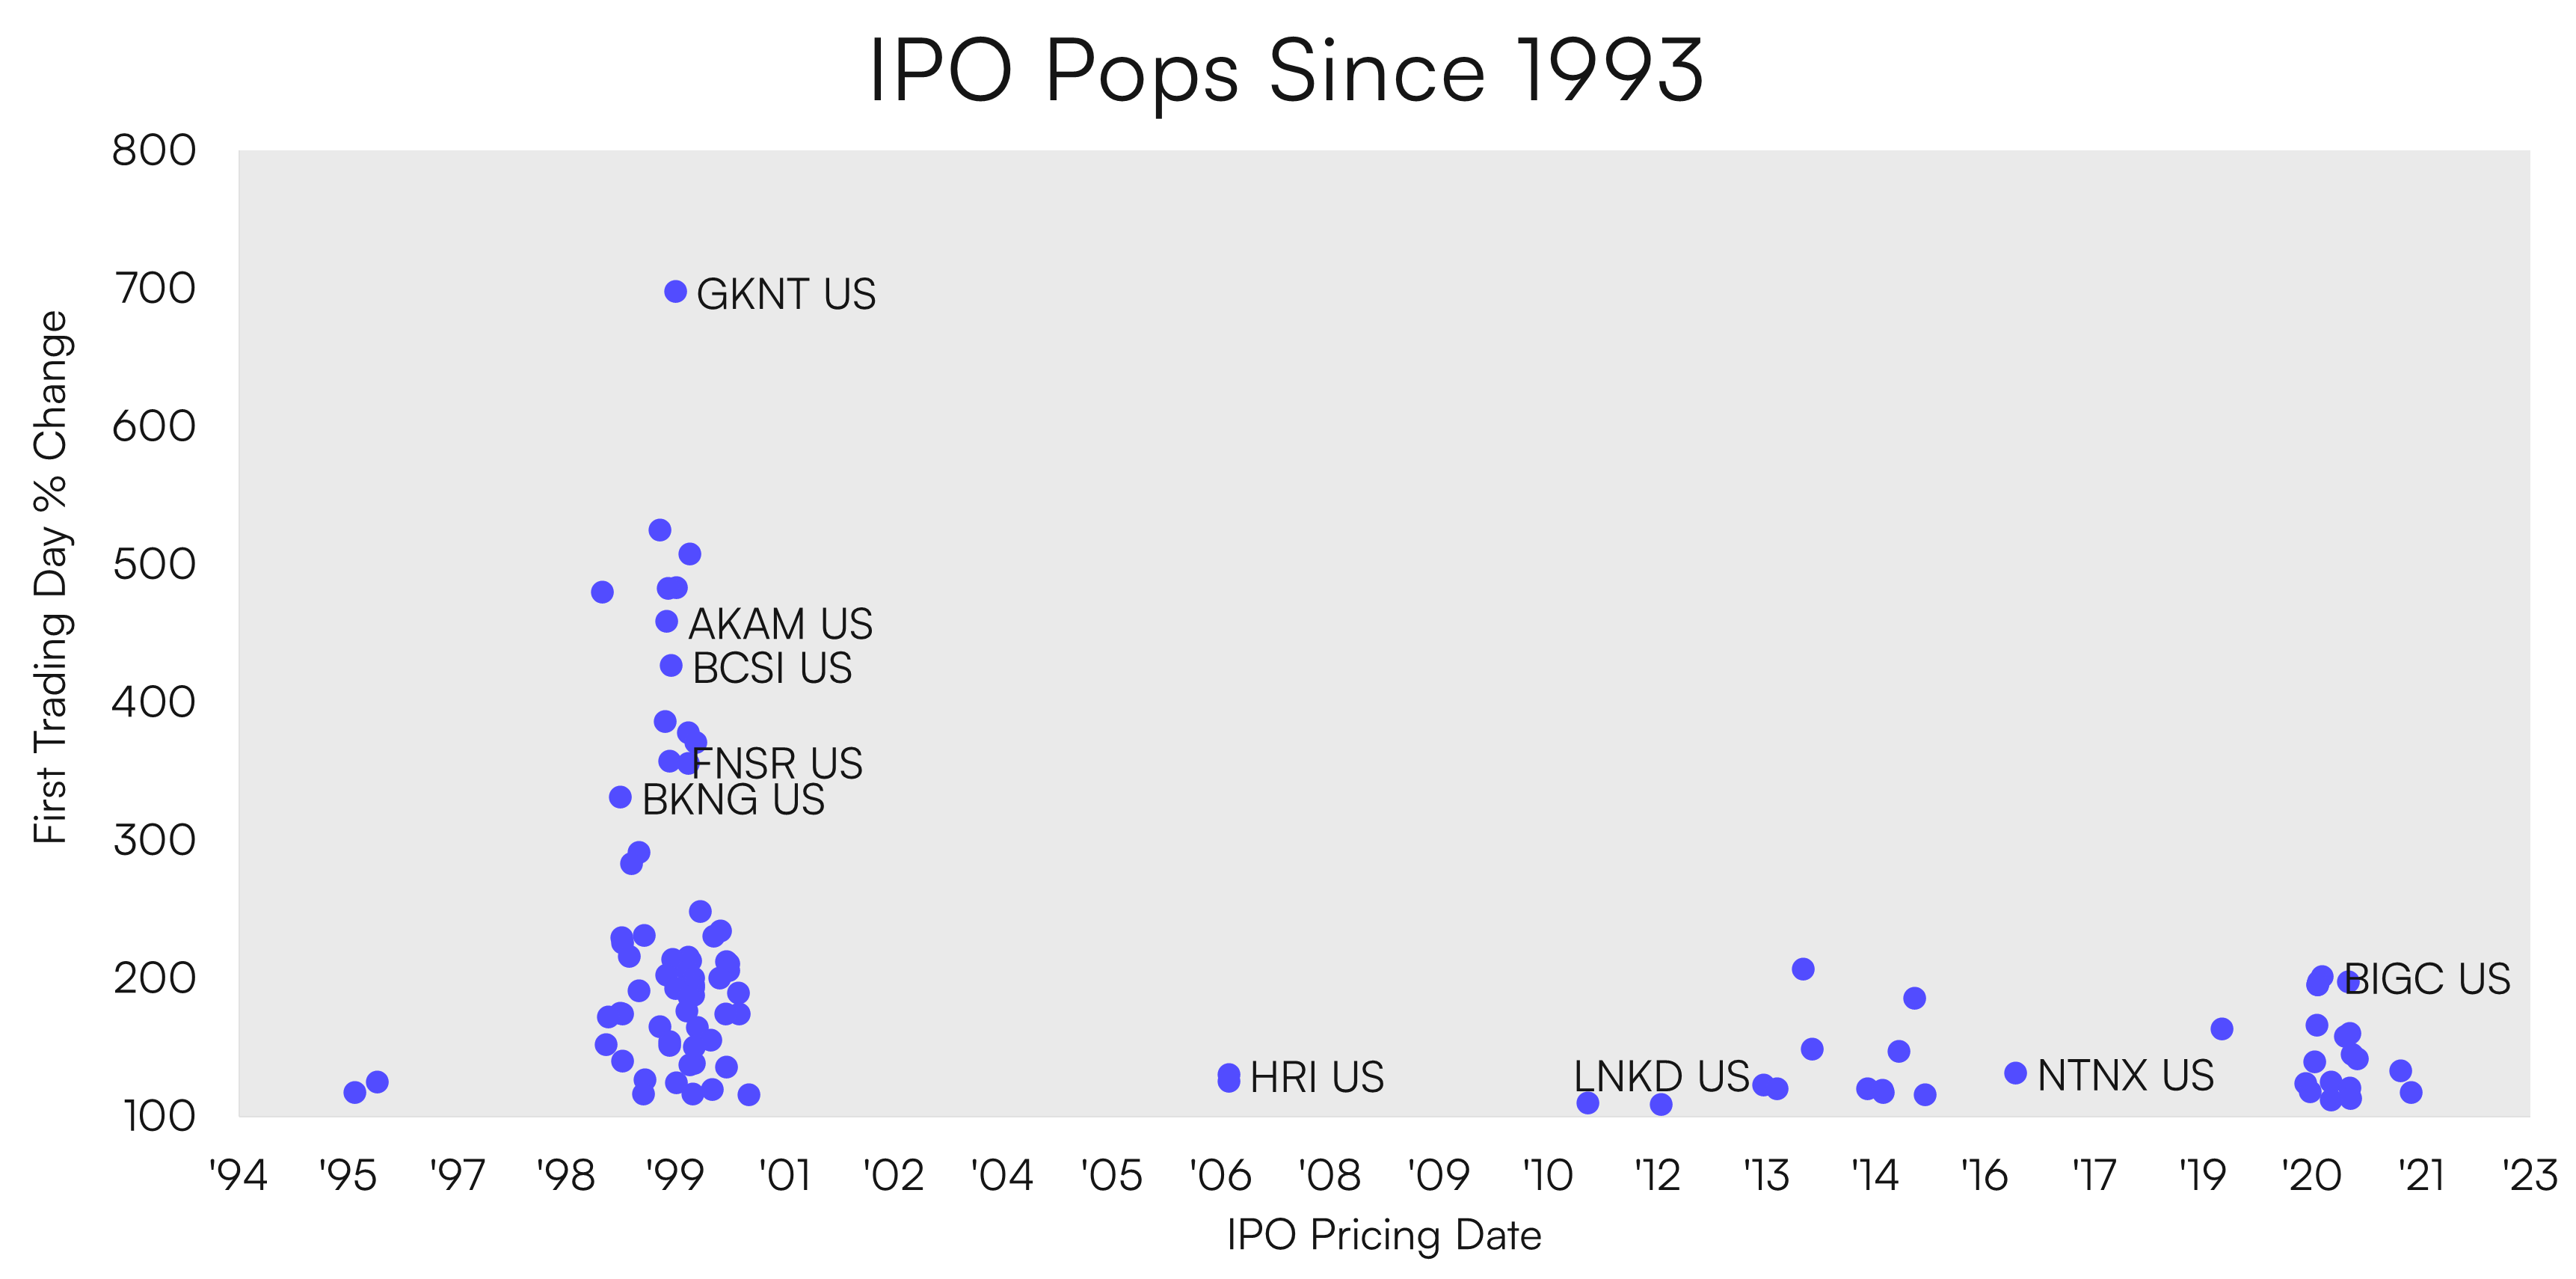
Source: Bloomberg, as of June 30, 2023
And if we compare two representative IPOs from the dotcom and AI eras, we can see differences in their underlying fundamentals at the time of their respective listings.
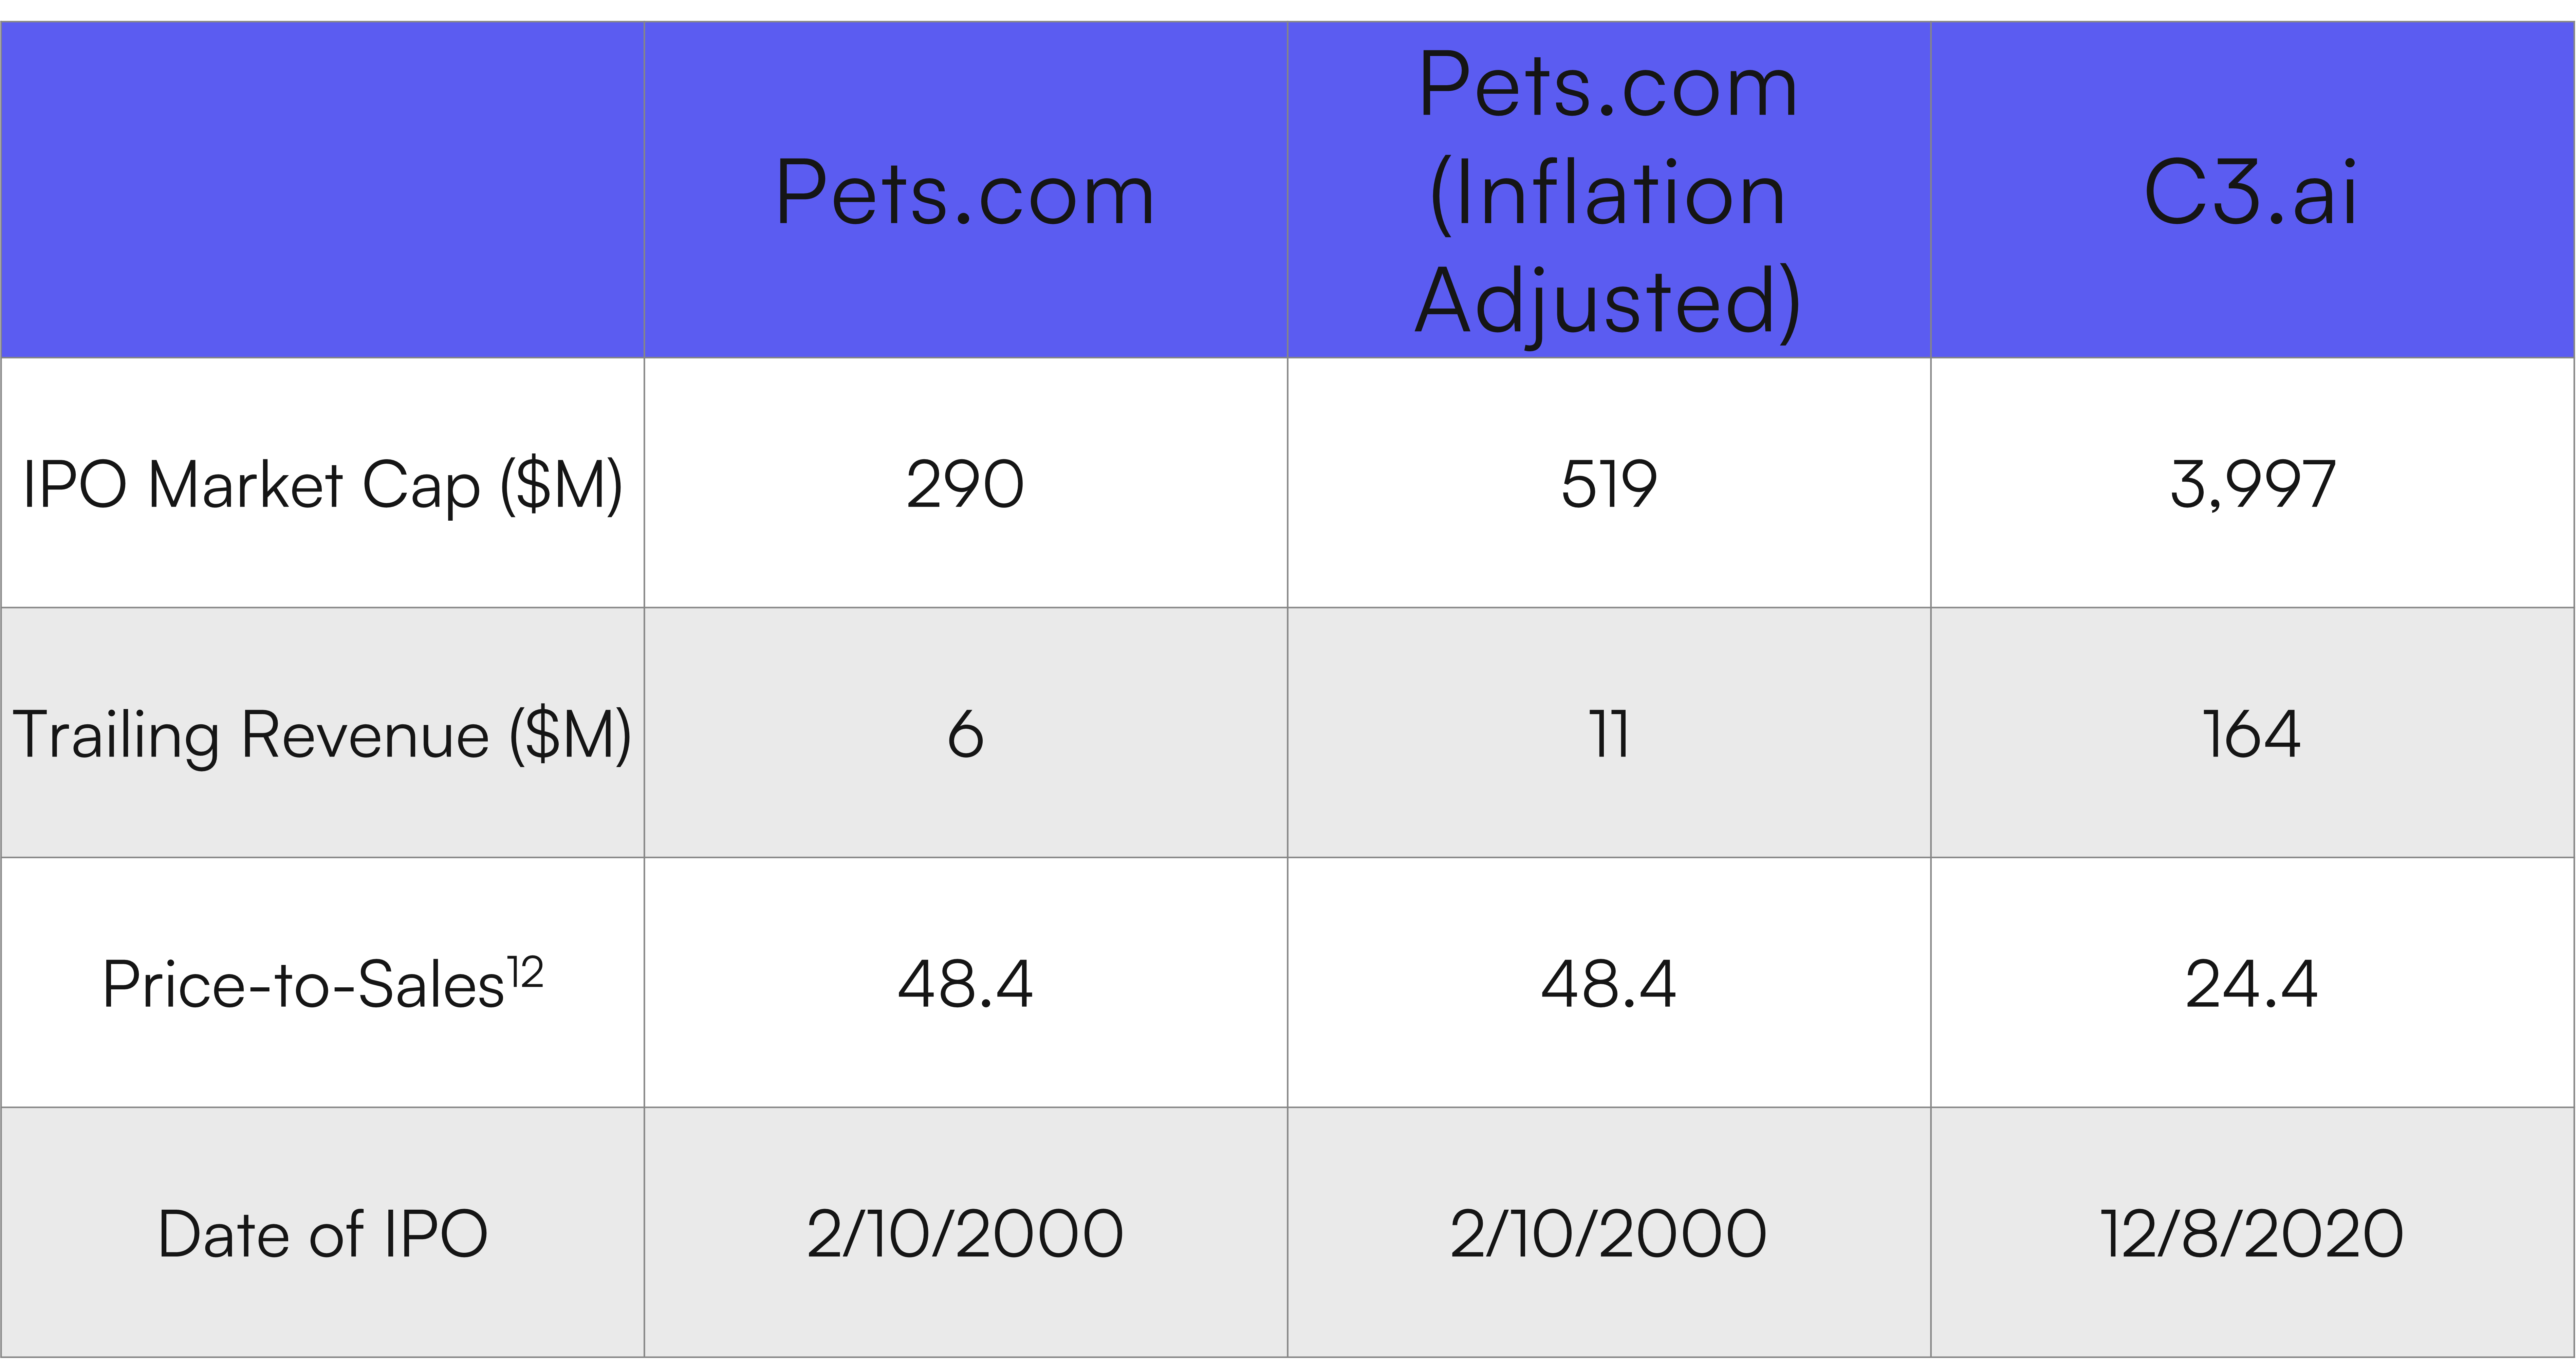
Source: Bloomberg, as of June 22, 2023
Note: Inflation-adjusted value adjusts 2000 values to current dollars for comparability purposes using the Bureau of Labor Statistics calculations.
C3.ai’s trailing 12-month revenue at the time of IPO was more than 27 times that of Pets.com but its price-to-sales ratio at IPO (24.4x) was less than half Pets.com’s (48.4x). In other words, AI IPO’d at a lower price multiple with considerably more revenue.
Bubble Check: No ❌
So is AI a Bubble?
Our analysis of potential irrational exuberance, high valuations, weak fundamentals and the IPO market suggest that AI is not yet in a bubble. Comparisons of the current market to the dotcom era simply ignore the actual underlying data points that would signal a bubble.
- Narratives ❌
- Irrational Exuberance ❌
- High Valuations ❌
- Weak Fundamentals ❌
- Increased Number of IPOs ❌
How to Invest in Generative AI’s Economic Transformation
Considering that generative AI is not yet showing signs of a bubble, how can you invest in the potential $7 trillion economic transformation4 from generative AI? The Roundhill Generative AI & Technology (CHAT) is the first and only ETF providing targeted exposure to generative AI. For more information on the fund, including access to the latest holdings and full prospectus, visit https://www.roundhillinvestments.com/etf/chat/.
Investors should consider the investment objectives, risk, charges and expenses carefully before investing. For a prospectus or summary prospectus with this and other information about Roundhill ETFs please call 1-855-561-5728 or visit the website at www.roundhillinvestments.com/etf/. Read the prospectus or summary prospectus carefully before investing.
Artificial Intelligence Company Risk. Companies involved in, or exposed to, artificial intelligence related businesses may have limited product lines, markets, financial resources or personnel. These companies face intense competition and potentially rapid product obsolescence, and many depend significantly on retaining and growing the consumer base of their respective products and services.
Technology Sector Risk. The Fund will invest substantially in companies in the information technology sector, and therefore the performance of the Fund could be negatively impacted by events affecting this sector. Market or economic factors impacting technology companies and companies that rely heavily on technological advances could have a significant effect on the value of the Fund’s investments. The value of stocks of information technology companies and companies that rely heavily on technology is particularly vulnerable to rapid changes in technology product cycles, rapid product obsolescence, government regulation and competition, both domestically and internationally, including competition from foreign competitors with lower production costs.
New Fund Risk. The Fund is a recently organized management investment company with no operating history. As a result, prospective investors do not have a track record or history on which to base their investment decisions. Small-Capitalization Investing. The securities of small-capitalization companies may be more vulnerable to adverse issuer, market, political, or economic developments than securities of large- or mid-capitalization companies. The securities of small capitalization companies generally trade in lower volumes and are subject to greater and more unpredictable price changes than large- or mid-capitalization stocks or the stock market as a whole.
Micro-Capitalization Investing. Micro-capitalization companies often have limited product lines, narrower markets for their goods and/or services and more limited managerial and financial resources than larger, more established companies, including companies which are considered small- or mid-capitalization.
Concentration Risk. The Fund will be concentrated in securities of issuers having their principal business activities in the technology group of industries. To the extent that the Fund concentrates in a group of industries, it will be subject to the risk that economic, political, or other conditions that have a negative effect on that group of industries will negatively impact them to a greater extent than if its assets were invested in a wider variety of industries.
The CHAT ETF is distributed by Foreside Fund Services, LLC
¹Generative artificial intelligence (generative AI or GAI) is a type of artificial intelligence that is designed to create new content, such as images, videos, or music. Unlike traditional AI, which is focused on recognizing and analyzing existing data, generative AI is focused on creating new data. This has the potential to revolutionize many industries, from entertainment and media to healthcare and education.
2The S&P 500 Index is an index tracking 500 of the largest companies listed on U.S. stock exchanges.
3The Nasdaq 100 Index is an index tracking 100 of the largest non-financial companies listed on the Nasdaq stock exchange.
4Goldman Sachs Global Investment Research, March 26, 2023
5The Nikkei 225 Index is an index tracking 225 Japanese companies listed in the First Section of the Tokyo Stock Exchange.
6The Hang Seng China Enterprises Index is an index of 50 leading Chinese companies listed on the Stock Exchange of Hong Kong.
7The Goldman Sachs Non-Profitable Tech Basket is a basket of non-profitable, U.S.-listed companies in innovative industries.
8The price-to-earnings multiple or ratio – or PE multiple or ratio (also written as P/E multiple or ratio) – is the company’s current price divided by its earnings per share and is used to compare the relative value of various securities or a single security across multiple time periods.
9The forward P/E ratio is the price to earnings ratio of a security utilizing the current consensus forward estimates for earnings per share. A trailing P/E ratio would use reported earnings per share for a stated period such as the last 12 months or the latest fiscal or calendar year.
10The forward EPS growth measures the growth of the consensus earnings per share (EPS) of the company over the next 12 months as compared to the reported EPS for the prior 12 months.
11The forward PEG ratio is the price-to-earnings-to-growth ratio, taking the forward P/E ratio and dividing it by the forward EPS growth (multiplied by 100). It is a valuation metric used to compare companies with different earnings growth rates.
12The price-to-sales ratio, similar to the P/E ratio, is the company’s current price divided by its sales per share. It is also used to compare the relative value of various securities or a single security across multiple time periods.