Roundhill Roundup: When Seven Means Hundreds
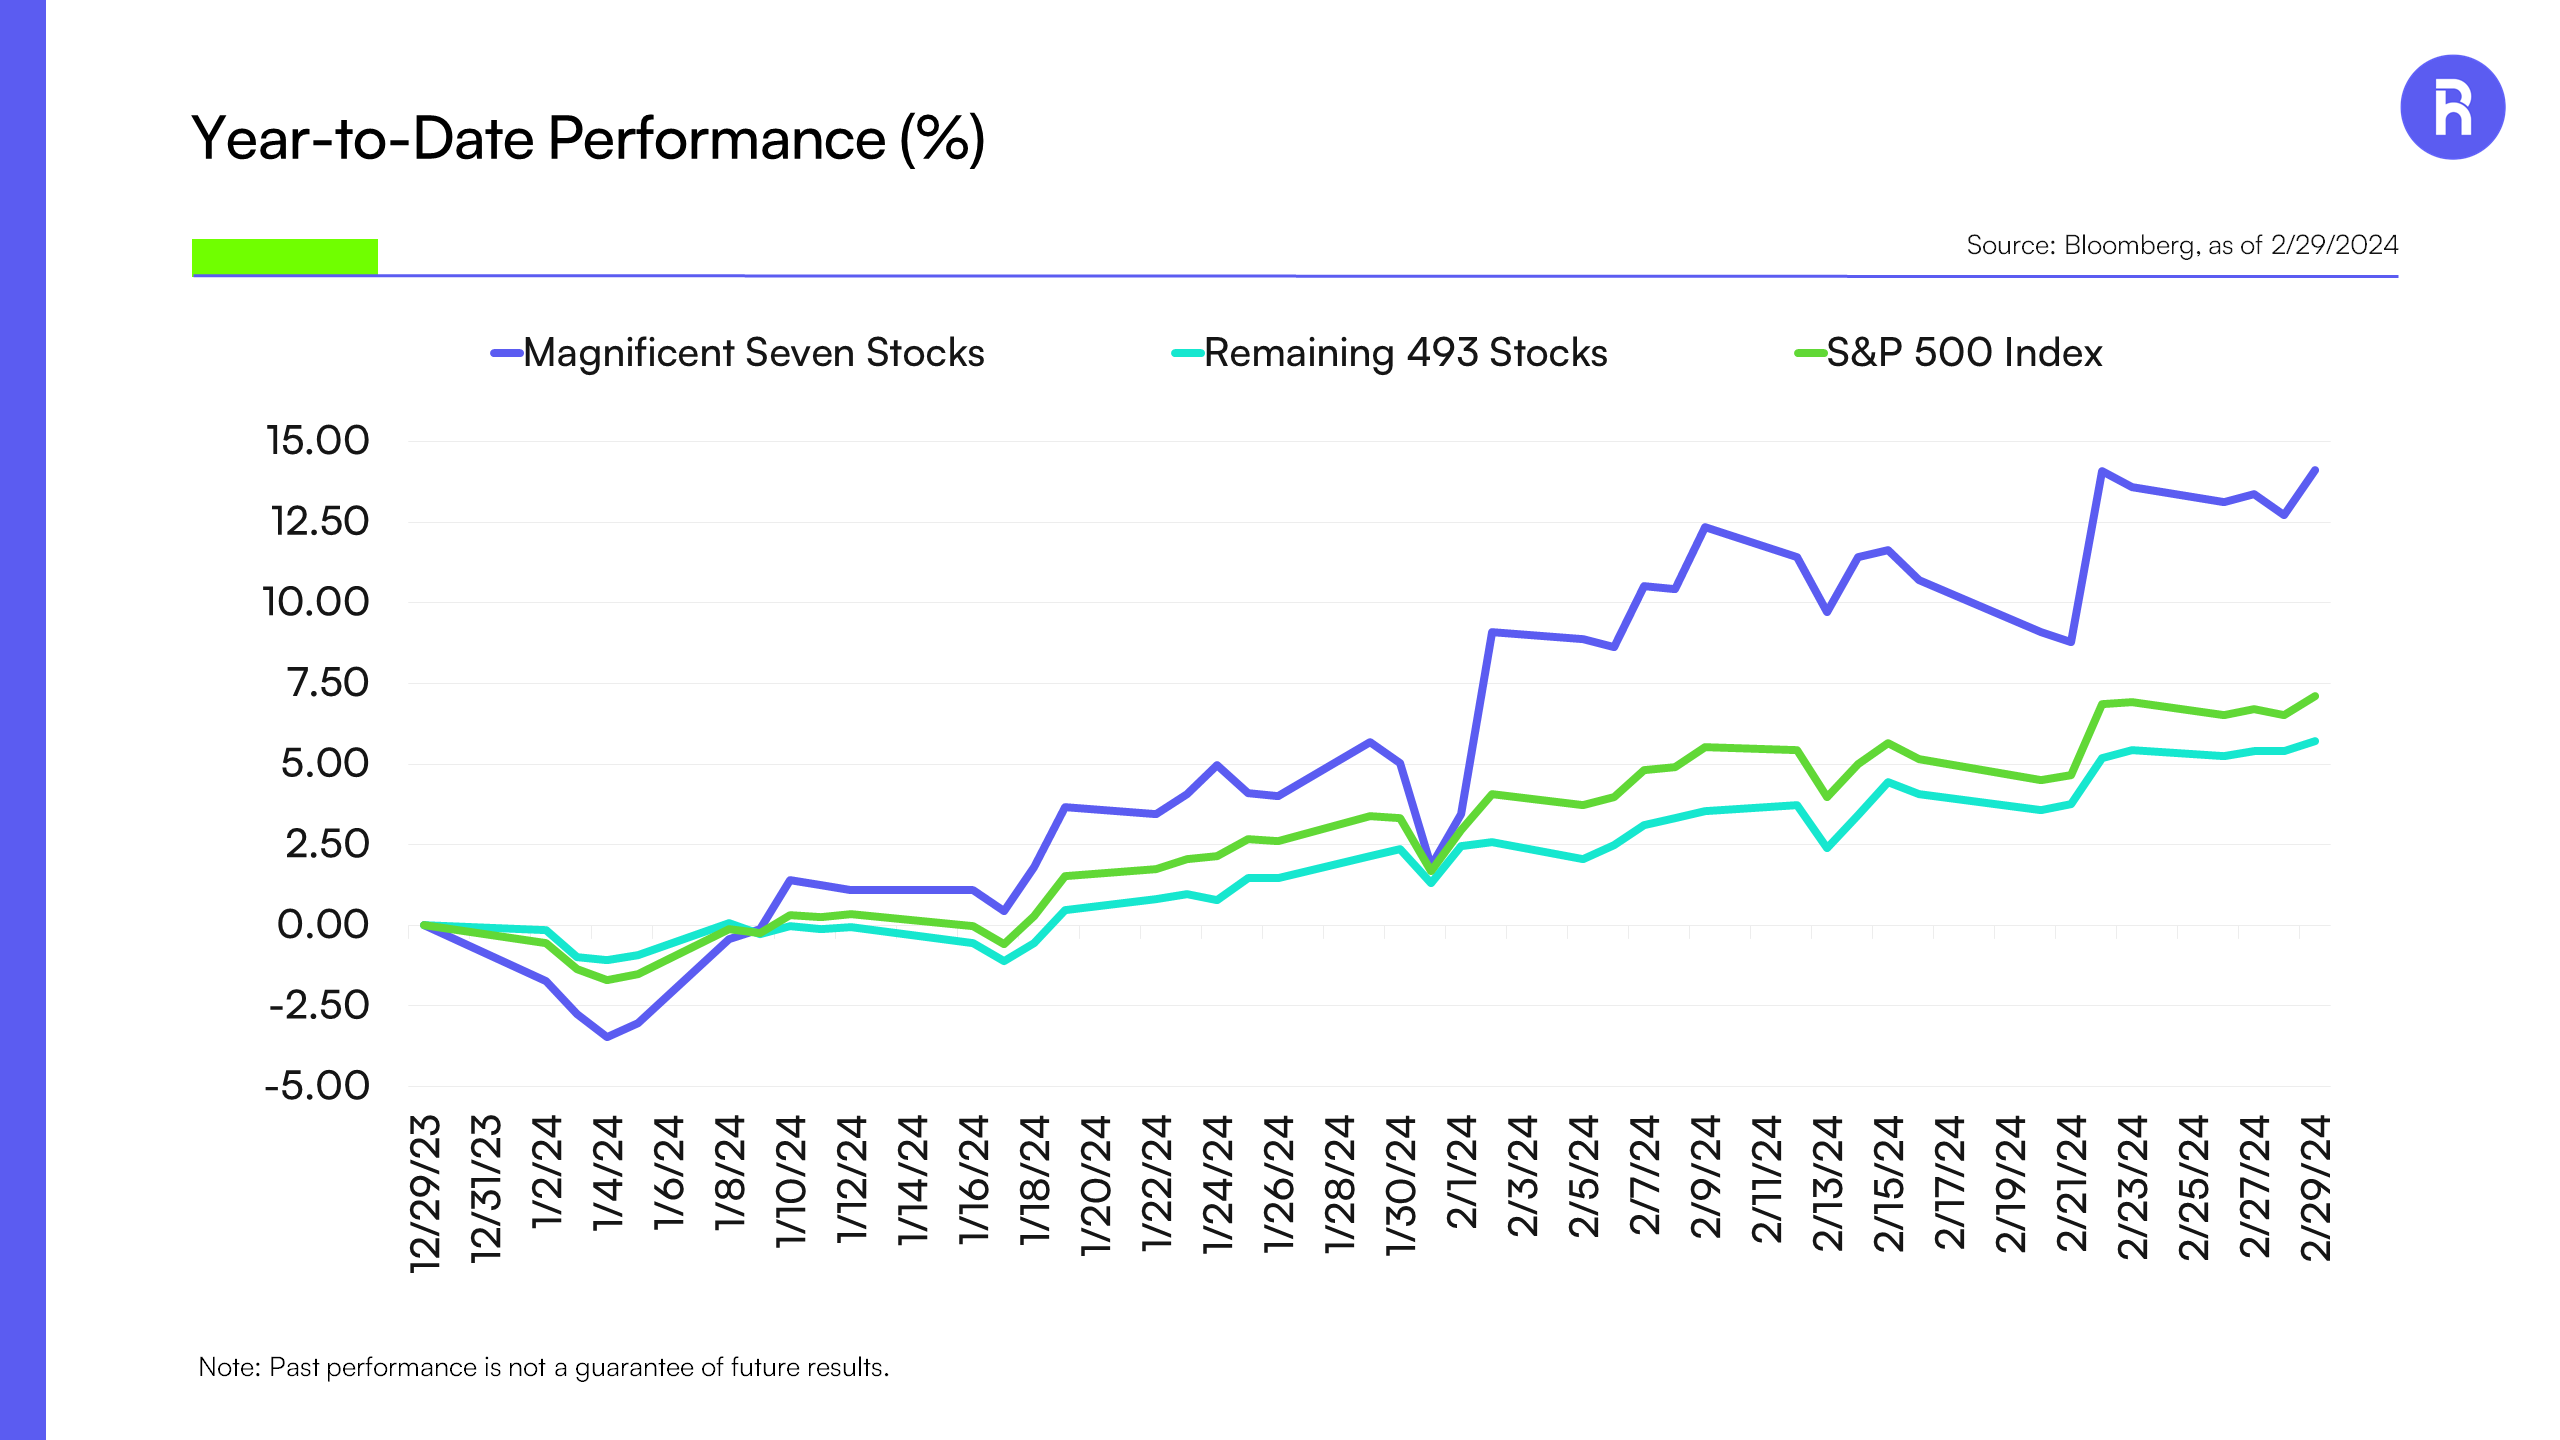
Through the first two months of the year, the Magnificent Seven Stocks have returned 14%, while non-profitable tech stocks are down 11%. Six of the Mag 7 companies beat consensus estimates for revenue. Specifically, the Magnificent Seven generated 15.0% sales growth year over year on average, while the other 493 generated a much more modest 2.7%.1 In addition, these market heavyweights have much higher operating margins than the rest of the market (22% versus 12%). Perhaps most importantly, the Magnificent Seven grew their margins over the last year while the remaining 493 saw a modest decline. Revenue and margin growth have been the key drivers of these seven stocks’ outperformance as we published in December 2023. Simply put, this has been more about fundamentals than AI hype.
Magnificent Seven Stocks Continue to Led

Source: Bloomberg, as of February 29, 2024.
Concentration Concerns
To a lot of negative headlines, the Magnificent Seven stocks contributed 57% of the S&P 500 Index’s return in 2023. Year-to-date, these seven market leaders have produced 44% of returns, which may still be high by historical measures, but is trending lower.2 While naysayers may point to overstated company estimates, one area of pushback that lacks evidence relates to concerns regarding overconcentration in the market. Rather, in this case, the seven stock market leaders represent considerably more than seven companies when one takes a look under the hood. In fact, it is more like the “Magnificent Hundreds” driving the U.S. economy and stock market.
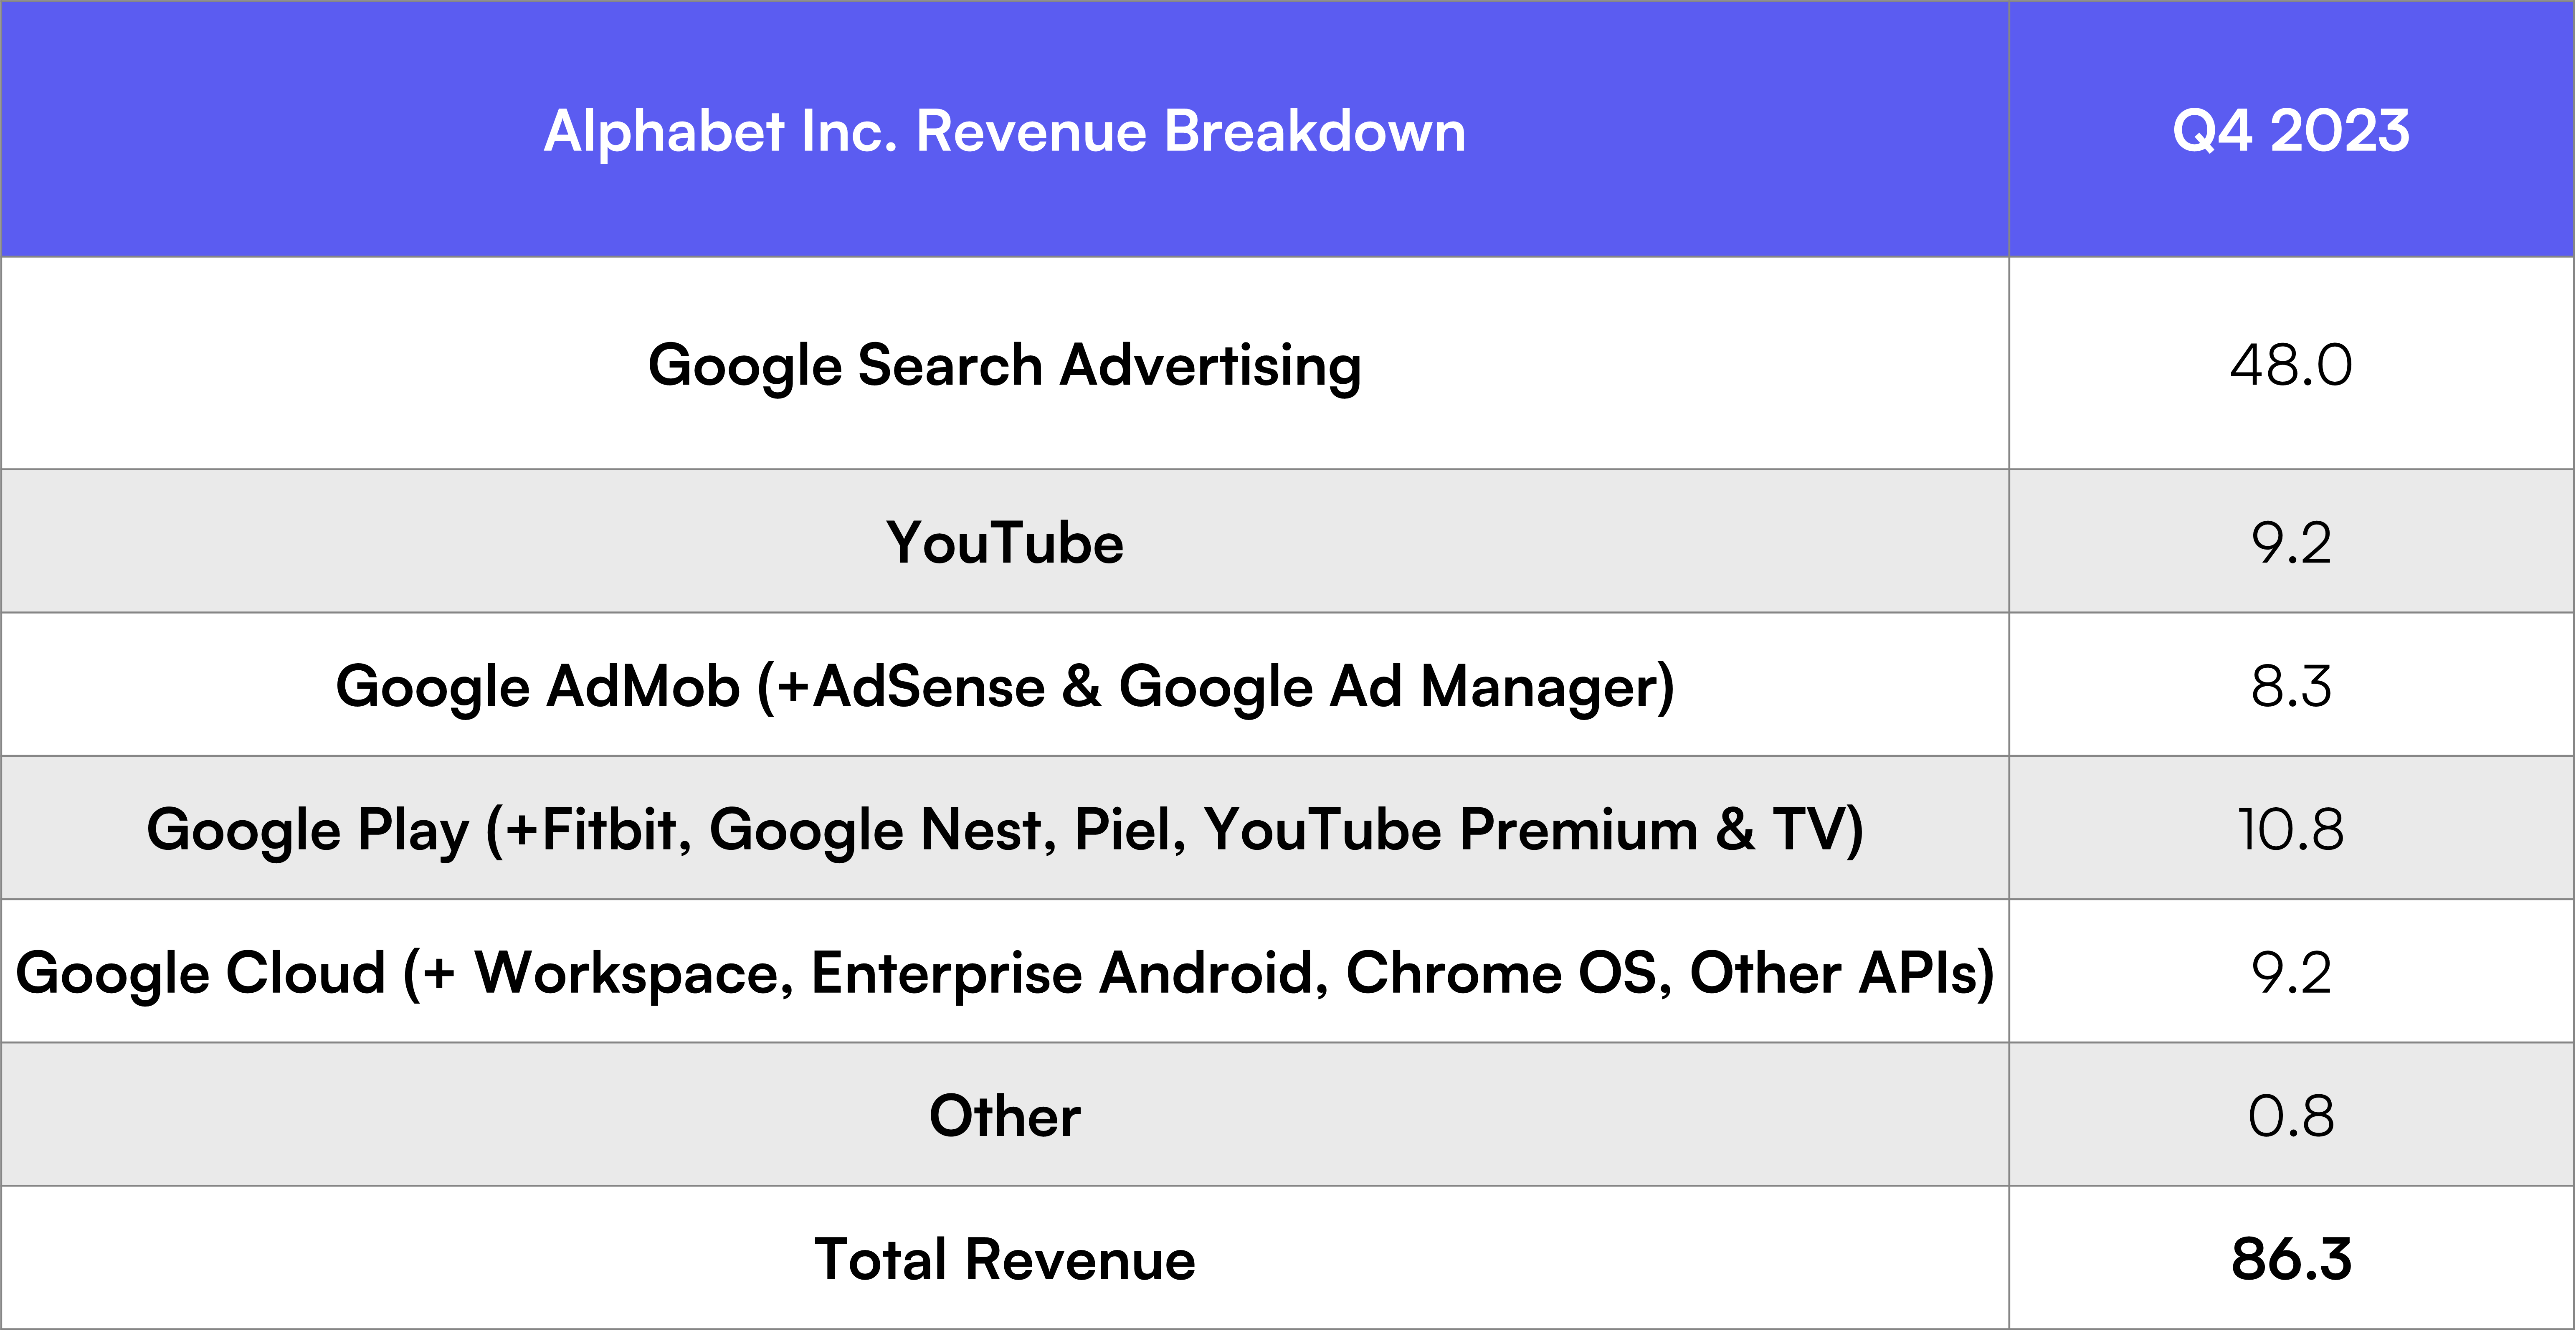
For example, Amazon owns more than 100 companies across various sectors, including technology, groceries, media, and medicine. Notable acquisitions include Whole Foods Market, Zappos, Twitch Interactive, MGM Holdings Inc., and Audible. Apple owns a significant number of companies, focusing on smaller technology firms that can be integrated into its products, such as Siri Inc., Beats Electronics and Beats Music, and Shazam. Alphabet has invested in over 200 companies, including YouTube. By way of example, the below figure highlights the diversity of Alphabet’s revenue streams including from search advertising, YouTube, Google AdMob, Google Play, and Google Cloud.
Alphabet Revenue Comes from a Variety of Companies

Source: Alphabet Inc., for the fiscal year ended December 31, 2023.
Dispersion Emerging
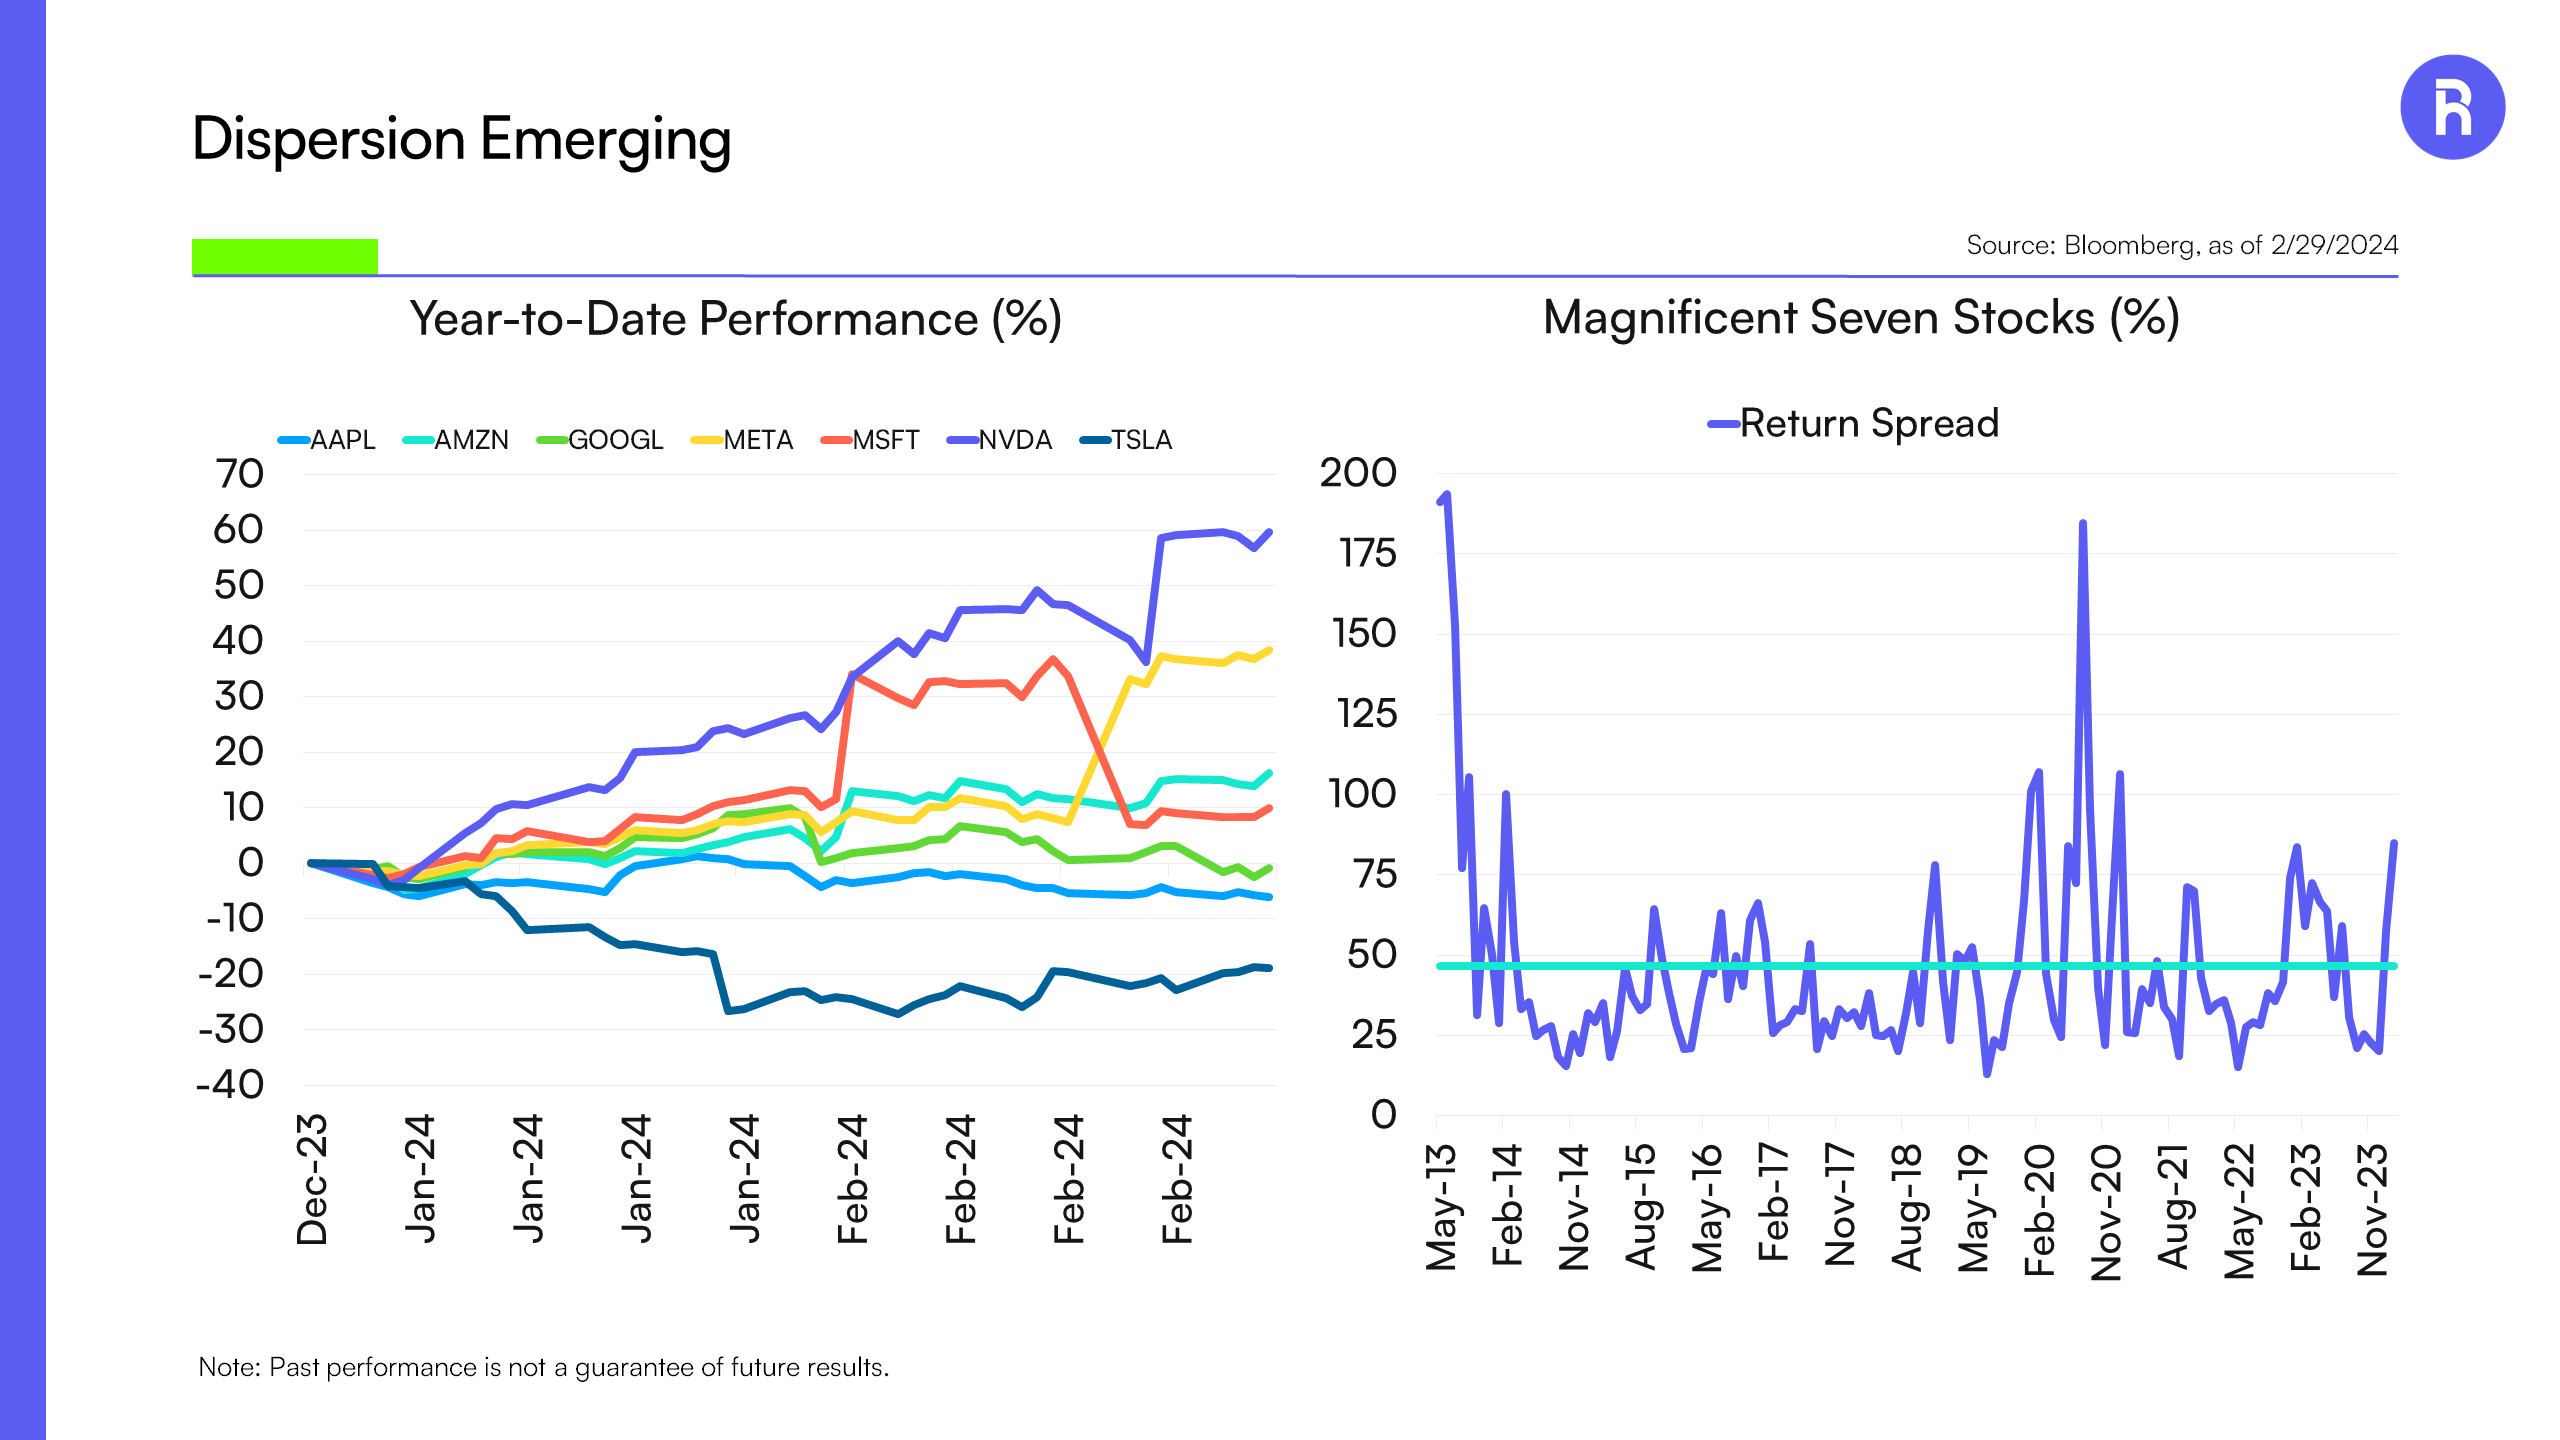
While some are concerned about concentration ,others are pointing to dispersion, with shares of Nvidia besting Tesla by 85% over the last three months. This sizable spread, combined with the fact that Apple and Alphabet have been relatively weak, have another group of investors and traders questioning the resiliency of the Magnificent Seven. This may be another example of when narratives do not align with the data. Interestingly enough, the average three month return spread of the best and worst performing Magnificent Seven stock is over 47%. So the 85% difference may be high at first glance, it is not outside of what has occurred historically.
Nvidia’s Leading, While Tesla’s Lagging

Source: Bloomberg., as of February 29, 2024.
What’s Next?
So while it is hard to ignore their dominance, the Magnificent Seven companies continue to grow their toplines faster than their smaller peers. As noted above, they are doing so with improving margin profiles as well. These two factors of fundamental growth are incredibly powerful in a low economic growth world with much higher interest rates than the previous decade.
To be fair, the 29 times forward price-to-earnings for the Magnificent Seven may look stretched if the group cannot continue delivering on their promise of consistently high sales and margin growth. If they do, bulls may keep the upper hand as the haves and haves not thesis plays out and AI remains in its early days of adoption. However, we recognize that this will not always be the case.
Not an offer: This document does not constitute advice or a recommendation or offer to sell or a solicitation to deal in any security or financial product. It is provided for information purposes only and on the understanding that the recipient has sufficient knowledge and experience to be able to understand and make their own evaluation of the proposals and services described herein, any risks associated therewith and any related legal, tax, accounting or other material considerations. To the extent that the reader has any questions regarding the applicability of any specific issue discussed above to their specific portfolio or situation, prospective investors are encouraged to contact 1-855-561-5728 or consult with the professional advisor of their choosing.
Forward-looking statements: Certain information contained herein constitutes “forward-looking statements,” which can be identified by the use of forward-looking terminology such as “may,” “will,” “should,” “expect,” “anticipate,” “project,” “estimate,” “intend,” “continue,” or “believe,” or the negatives thereof or other variations thereon or comparable terminology. Due to various risks and uncertainties, actual events, results or actual performance may differ materially from those reflected or contemplated in such forward-looking statements. Nothing contained herein may be relied upon as a guarantee, promise, assurance or a representation as to the future.
The performance data quoted represents past performance. Past performance does not guarantee future results. Current performance may be lower or higher than the performance data quoted. The investment return and principal value of an investment will fluctuate so that an investor's shares, when sold or redeemed, may be worth more or less than their original cost. Returns less than one year are not annualized. For the most recent month-end performance, please call (855) 561-5728. You cannot invest directly in an index. Shares are bought and sold at market price (closing price), not net asset value (NAV), and are individually redeemed from the Fund. Market performance is determined using the Primary Exchange official closing price. Brokerage commissions will reduce returns.
Carefully consider the investment objectives, risks, charges and expenses of Roundhill ETFs before investing. This and other information about each fund is contained in the Prospectus. Please read the prospectus carefully before investing as it explains the risks associated with investing in the ETFs.
These include risks related to investments in small and mid-capitalization companies, which may be more volatile and less liquid due to limited resources or product lines and more sensitive to economic factors. Funds investments may be non-diversified, meaning its assets may be concentrated in fewer individual holdings than a diversified fund and, therefore, more exposed to individual stock volatility than diversified funds. Investments in foreign securities involves social and political instability, market illiquidity, exchange-rate fluctuation, high volatility and limited regulation risks. Emerging markets involve different and greater risks, as they are smaller, less liquid and more volatile than more develop countries. Depositary Receipts involve risks similar to those associated with investments in foreign securities, but may not provide a return that corresponds precisely with that of the underlying shares. All investing involves risk, including possible loss of principal. Please see the prospectus for specific risks related to each fund.
NERD, BETZ, METV, WEED, CHAT, BIGB, MAGS, LNGG, LUXX, KNGS, MAGX. MAGQ. QDTE. XDTE, and YBTC are distributed by Foreside Fund Services, LLC. DEEP is distributed by Quasar Distributors, LLC.


